Figures & data
Table 1. The percent nucleotide and amino acid identity of the NiV isolates with NiV-M reference isolate (NC002728).
Figure 1. Characterization of NiV in cells: Growth kinetics in the Vero (ATCC® CCL − 81™) cells expressed in a) TCID50 and b) viral RNA copy number/ml. c) Vero CCL − 81 cells showing cytopathic effects after 1 day post NiV infection, and d)cell control. Differential expression of NiV genes in e) Vero-CCL81 cells expressed as RPKM values at different time points. f) BHK − 21 cells infected with NiV showing cytopathic effect on 3 days post infection and g) BHK − 21 cell control. Differential expression of NiV genes in h) BHK − 21 cells expressed as RPKM values at different time points.
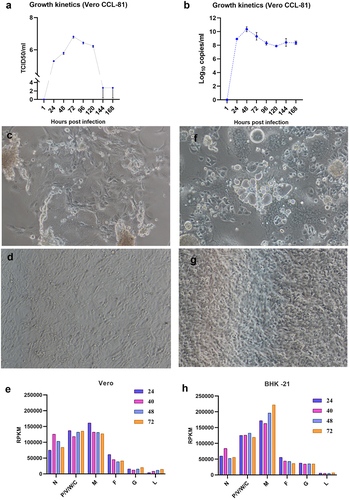
Figure 2. Survival and body weight changes in hamsters after NiV infection. a) Percent survival and b) body weight change in hamsters post intraperitoneal infection. c) Percent survival and d) body weight change in hamsters post intranasal infection.
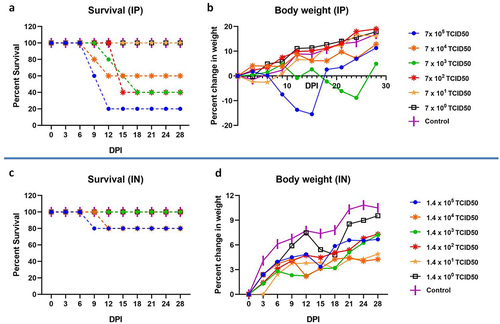
Figure 3. NiV RNA shedding and viremia in hamsters post intraperitoneal infection. a) Viral shed through the nasal wash, oral and rectal route. b) Viral RNA in serum samples collected from hamsters on various time points. The individual values along with median value are plotted in the graph.
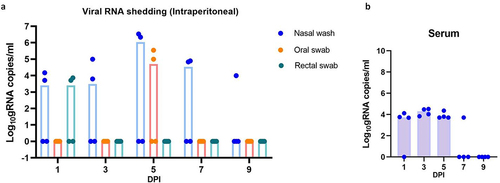
Figure 4. NiV load in organs of hamsters after intraperitoneal infection. Viral RNA load in a) brain b) heart c) lungs d) trachea e) intestine f) spleen g) liver and h) kidney. i) Live virus load in brain, lungs, spleen and kidney. The individual values along with median value are plotted in the graph.
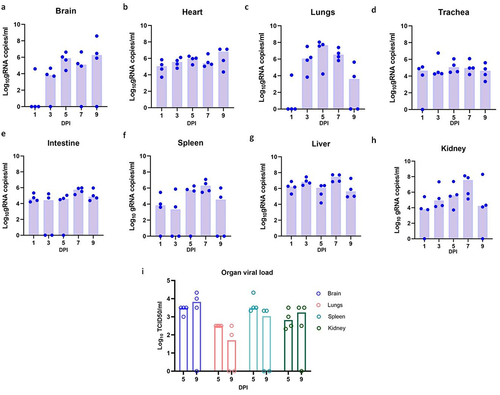
Figure 5. Histopathological observations in NiV infected hamsters after intraperitoneal infection. a) Lung section showing multifocal perivascular inflammatory cell infiltration in the alveolar parenchyma (arrows) on 3 days post infection, (H& E, scale bar = 100 µm). b) Lung section showing vasculitis, thrombosis and diffuse alveolar thickening on 7 days post infection, (H& E, scale bar = 100 µm) c) Blood vessel in the lungs showing multiple endothelial cell syncitia formation (arrows) and perivascular mononuclear cell infiltration, (H& E, scale bar = 200 µm) d) Lung section showing normal histological features, (H& E, scale bar = 200 µm) e) Brain section showing blood vessels with haemorrhage in the perivascular space, (H& E, scale bar = 200 µm). f) Brain section showing multiple blood vessels with perivascular cuffing, (H& E, scale bar = 100 µm). g) Brain section showing blood vessels with perivascular cuffing (yellow arrows) and gliosis (red arrow), (H& E, scale bar = 200 µm). h) Brain section showing normal histological features, (H& E, scale bar = 100 µm) i) Kidney section showing diffuse vascular engorgement, (H& E, scale bar = 200 µm).J) Kidney section showing congested blood vessels and thrombotic plugs in the glomerular capillaries, (H& E, scale bar = 200 µm).K) Kidney section showing normal histological features, (H& E, scale bar = 100 µm).
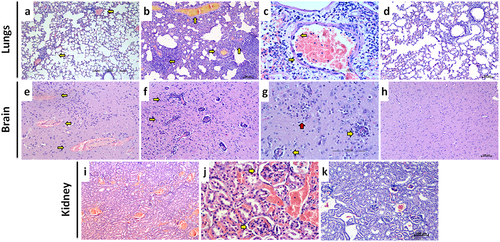
Figure 6. Host gene expression in hamsters after intraperitoneal NiV infection. Fold change of A) IL − 1 B) IL − 4 C) IL − 6 D) IL − 10 E) IL − 12 and F) IFN- γ in brain, lungs, and spleen. The individual values along with median value are plotted in the graph.
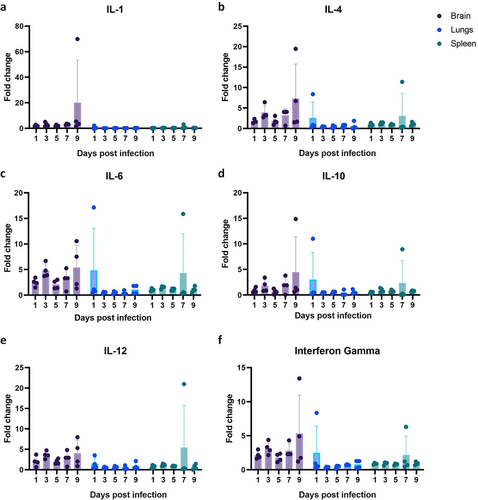
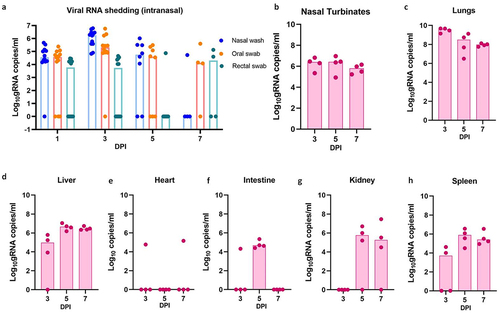
Figure 7. Viral RNA load in hamsters post intranasal NiV infection. A) Viral RNA shed through the nasal wash, oral and rectal route. Viral RNA in B) lungs c) liver d) heart e) intestine f) kidney and spleen samples collected from hamsters on various time points. The individual values along with median value are plotted in the graph.
Supplemental Material
Download MS Word (105.5 KB)Data Availability statement
The authors confirm that the data supporting the findings of this study are available within the article. The transcriptome data that support the findings of this study are openly available in NCBI at https://www.ncbi.nlm.nih.gov/sra/?term=, reference number. [SRR24202203, SRR24202204, SRR24202205, SRR24202206, SRR24202207, SRR24202208, SRR24202209, SRR24202210, SRR24202211, SRR24202212].

