
Figures & data
Figure 1. (a) the structure of the NA protein tetrad displaying the head region is depicted. Each monomer is shown to have an SA residue attached to its head, which serves as the site of enzyme activity. (b) the four polypeptide monomers of NA fold and assemble into a tetrameric structure encompassing a spherical head region, a stem, a transmembrane region, and a cytoplasmic tail. The head region of the depicted NA was derived from the Protein Data Bank (PDB:4GZW), and the corresponding protein model was generated using Pymol software. (c) the relative positions of the enzyme active site (highlighted in yellow) and the second receptor binding site (highlighted in blue and red: 366–373, 399–404, 430–433) at the head region of each NA monomer are shown, with the red area (364, 367, 369, 400, 403, 432) denoting the contact site of the second receptor binding site of NA. The location of the D151G mutation is illustrated in green. Each monomer binds to an α-2,3 sialic acid (SA). The NA structure displayed in the figure was obtained from the Protein Data Bank (PDB:4GZW), and the protein model was generated using Pymol software.
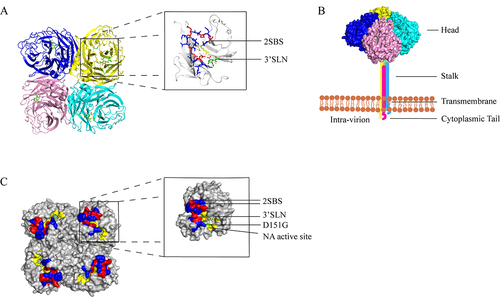
Figure 2. The sequence of the three loops (residues 366 to 373), 400 loop (residues 399 to 404), and 430 loop (residues 430 to 433) that form the second receptor binding site of the N1, N2, and N9 in humans and birds. This Seqlogo was generated by the WebLogo program (http://weblogo.berkeley.edu/logo.cgi) using strains retrieved from the GenBank database.
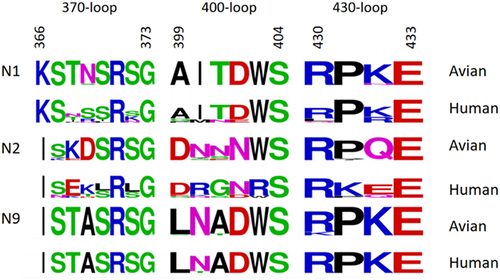
Table 1. Molecular markers associated with receptor-binding properties of NA.
Data availability statement
The datasets used and/or analysed during the current study are available from the corresponding author on reasonable request.