Figures & data
Figure 1. The geographical distribution and genetic relationships among 203 ST121 isolates examined in this study. (a & c) Geographical distribution of 203 ST121 S. aureus isolates around the world and 28 ST121 from our collection in China. The countries or Chinese provinces with ST121 isolates are marked by background colour fill. (b & d) MST of 203 ST121 S. aureus isolates around the world and 28 ST121 from our collection in China. Each filled circle represents a ST121 isolate. The number of SNPs in pairwise comparisons is indicated on the connecting lines. The potential transmission clusters based on the threshold of 23 SNPs are marked with grey.
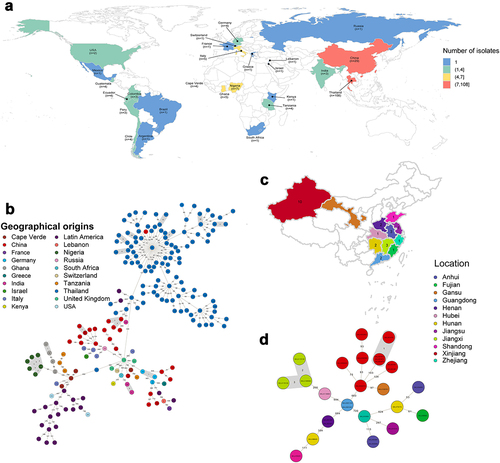
Figure 2. Phylogenetic trees of ST121 isolates. (a) Phylogenetic tree of 203 ST121 isolates from around the world. Tips are labelled by spa type of the isolates and coloured according to country of isolation. The SCCmec type, host type, presence of ebpS-v, PVL, eta, etb, edin-A, and edin-C are mapped on the tree (from inner to outer circle). (b) Phylogenetic tree of 28 ST121 isolates from our collection in China. Tips are coloured based on provinces in China.
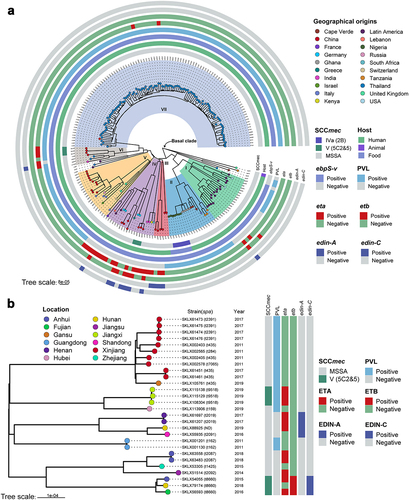
Figure 3. Heatmap of virulence factors and MGEs among the ST121 isolates. The isolates from our collection are indicated by red asterisks.
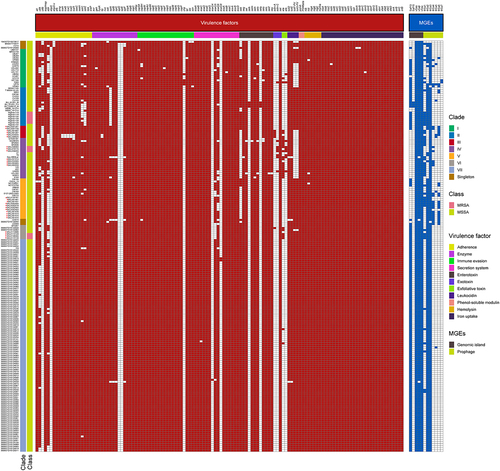
Figure 4. Comparison of pathogenicity islands and prophages among ST121 isolates, and USA300, MW2, and ST59 strains. Comparison of the genomic structure of (a) vSaβ, (b) SaPI and (c) ΦSa2 between ST121 isolates, USA300, MW2, and ST59 strains. Arrowed boxes represent genes that are coloured according to functional classification.
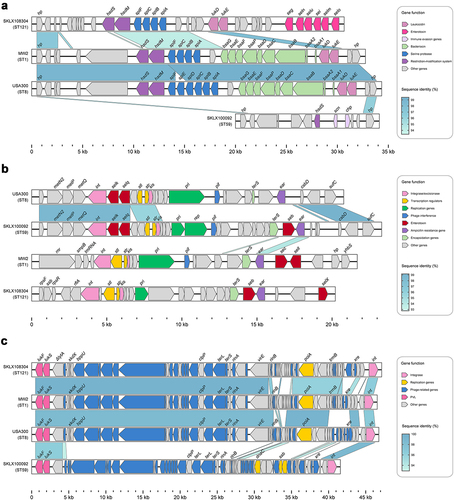
Figure 5. Virulence phenotype of MRSA ST121 strains from our collection, the CA-MRSA clone USA300, USA400 MW2, and ST59. (a) Survival curves of G. mellonella larvae (n = 20 per strain) infected with strains or sterile PBS. (b) Skin lesion in the mouse skin infection model. Five mice were infected per strain. **, P < 0.01; NS, not significant (P ≥ 0.05).
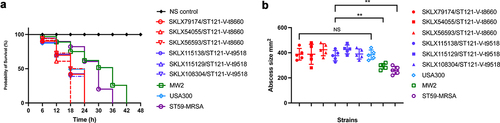
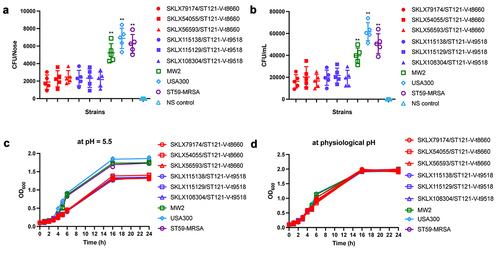
Figure 6. Nasal colonization, cell adhesion capacity, and growth rates of ST121-MRSA isolates from our collection and the CA-MRSA clones USA300, MW2, and ST59. (a) Nasal colonization capacity of strains. Data for each ST121 MRSA isolate in five mice were averaged. (b) Adhesive capacity of tested strains in A549 human alveolar epithelial cells. (c, d) Growth curves of strains in the acid environment (pH 5.5) and physiological environment (pH 7.4). **, P < 0.01.