
Figures & data
Figure 1. Theront of I. multifiliis. (a, b) Holistic view of the theront. (c, d) Magnified perforatorium at the apex. Arrowhead indicates the extrusive contents. (e) Cytostome. (f) Caudal cilium at the terminal end. (g) Longitudinal section views of theront. Arrowhead indicates the anterior part. (h) Cytoplasm of the anterior part of theront. (i) Cross section of toxicyst. (j) Longitudinal view of toxicyst showing the tube-like core (arrowhead) located within the capsule and a fibro-granular layer at the posterior end. (k) Cortex of theront. (l) Extrusion of vacuole from cilia membrane. Arrowhead indicates the ejected vacuole. Scale bars 5 μm (a, b, g), 2 μm (c, d, h), 1 μm (e, f, j), 500 nm (k), 200 nm (i, l).
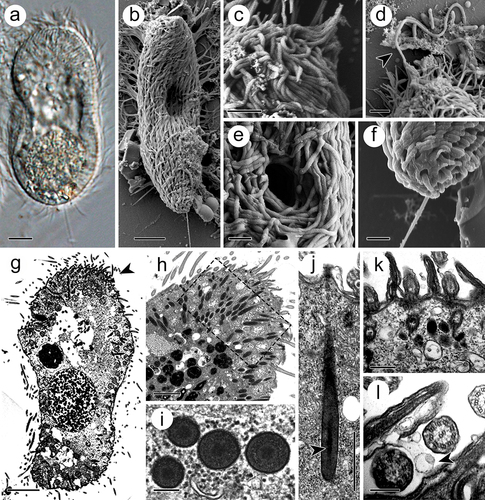
Figure 2. Trophont of I. multifiliis. (a, b) Holistic view of trophont. (c, d) Cytostome with nearly apex of trophont (arrowhead) where kineties rationally extended. (e, f) Cortex periphery of trophont. (g) Rosettes of mucocyst (arrowheads) contains amorphous materials laid down the cell membrane. (h) Magnification of mucocyst. (i – k) Mucocysts at different extrusive stage. M, mucocyst; Mi, mitochondrion, T, toxicyst. Scale bars 50 μm (a, b), 20 μm (I), 10 μm (c), 5 μm (d, e, g) 2 μm (f, h, i), 1 μm (j, k).
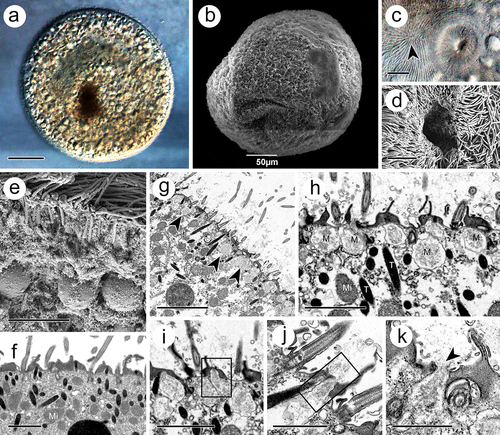
Figure 3. Tomont of I. multifiliis. (a) Holistic view of the tomont enveloped by cyst wall. (b) the cyst wall trapped with bacteria and debris (arrowhead). (c, d) Multi-layers of the cyst wall. Arrowheads and “*” indicated the separated layers. (e) Dividing offspring. Arrow indicates the cyst wall and arrowhead indicates the inner membrane. (f and g) Inner membrane (arrowheads) of tomont. (h, i) Holistic view of the offspring in tomont. arrowhead showed the cytostome. FV, food vacuoles; Ma, macronucleus; Mi, micronucleus. Scale bars 50 μm (a, e), 20 μm (b), 10 μm (f, h, i), 1 μm (d, g), 500 nm (c).
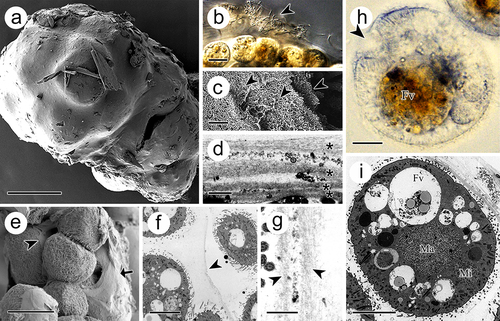
Figure 4. Differential gene expression among the stage. (a – c) Volcano plots showing differentially expressed genes (DEGs) in theront compared to tomont, in trophont compared to theront, and in tomont compared to trophont, respectively. (d – f) GO enrichment analysis based on the up-regulated DEGs in trophont, tomont, and theront, respectively. Gene ratio is the percentage of total DEGs in the given GO term.
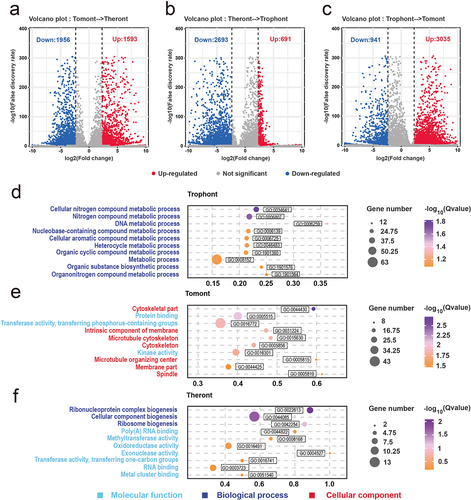
Figure 5. KEGG analysis on the DEGs of I. multifiliis. (a) an overview of annotated pathways in trophont-tomont, and tomont-theront. (b) the number of up-regulated and down-regulated genes in top 30 -log10(Qvalue) pathways. (c) GSEA analysis genes related to pathways of transport and catabolism, signal transduction, and membrane transport.
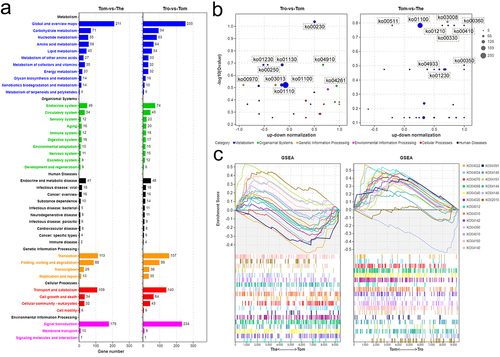
Figure 6. Characterization and expression patterns of Rabs gene family in I. multifiliis. (a) an un-rooted ML phylogenetic tree based on amino acid sequences of I. multifiliis Rabs. (b) the motif composition of I. multifiliis Rabs. The motifs are displayed in different coloured boxes. (c) Expression profiles of Rab-related genes at different stages of I. multifiliis. (d) KEGG analysis of the 25 Rab-related genes in I. multifiliis. (e) Expression profiles of six selected Rab-related genes at different stages of I. multifiliis.
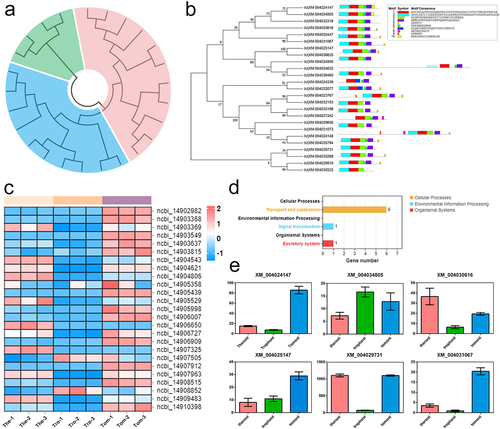
Table 1. Twenty-five Rab family genes expressed profiles in Ichthyophthirius multifiliis.
Supplemental Material
Download Zip (355.4 KB)Data availability statement
Data will be made available from the corresponding author by request.