
Figures & data
Table 1. Primers used in this study.
Figure 1. PrsA induced cell death without autophagy and early apoptosis pathway activation in RAW264.7. a. Autophagy activation detected by western blotting with LC3B molecules. Cells were stimulated with PrsA in different concentrations or Rapamycin for 4 hs. Whole-cell lysates were subjected to western blotting. b. Apoptosis identification by chromatin staining. Cells were stimulated with PrsA (50 μg/ml) for 4 hrs. Then, cells nuclei were stained with DAPI. Increased apoptotic cells with fragmented and brighter chromatin were indicated with white arrows in the positive control group treated with staurosporine (200 nM). Magnification, ×400. c. Agarose gel electrophoresis analysis of DNA fragmentation in cells genome treated as b. d & e. Apoptotic cell death determined by flow cytometric analysis and TUNNEL staining in RAW264.7 cells after PrsA protein stimulation. DNase I was conducted as positive control for TUNNEL assay. The asterisk of “**” indicated significant at P < 0.01.
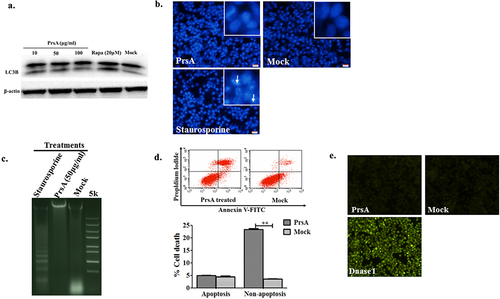
Figure 2. Pyroptosis was involved in cell death induced by the PrsA protein. a & b. Cytotoxicity determination of PrsA at different concentrations in RAW264.7 cells detected by fluorescent observation of live (green) and dead (red) and LDH quantification kit after 1 h or 2hs incubation. c. Fluorescent observation of RAW264.7 cells treated with PrsA only (75 μg/ml) or PrsA with a cell-permeable, selective, and irreversible inhibitor of the cysteine protease caspase-1 (Ac-YVAD-cmk, 100 μM) for 4 hs. Bar scales were 50 μm. d. Quantitative detection of cytotoxicity in cells subjected with or without Ac-YVAD-cmk inhibitor by an LDH release measurement kit. Cellular lysis buffer of triton X-100 (0.2%) was treated and considered 100% death for cytotoxicity calculation. DMEM medium treatments were used as a negative control. The asterisk of “**” indicated significant at P < 0.01.
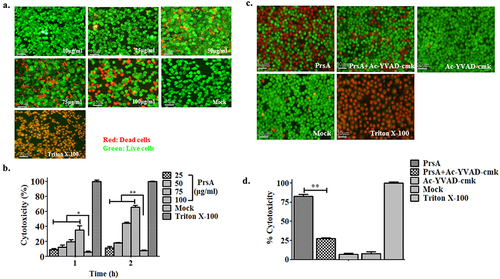
Figure 3. PrsA-induced cell death partially by necroptosis signalling pathway. a & b. Fluorescent observation of live (green) and dead (red) RAW264.7 or HEp-2 cells treated with PrsA only (75 μg/ml) or PrsA with specific inhibitor Nec-1 (20 μM) and NSA (10 μM) for 4 hs targeted RIPK-1 and MLKL, respectively, in necroptosis pathway. Bar scales indicated 50 μm. c & d. Evaluation of cytotoxicity with LDH release assay kit. RAW264.7 or HEp-2 cells were treated as panels a & b.
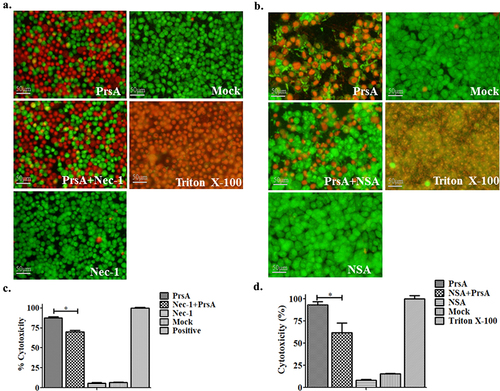
Figure 4. Electronic microscopy observation.
Figure 5. Confirmation of lethal function and potential cell death patterns activated by PrsA in RAW264.7 cells infected with SS2.
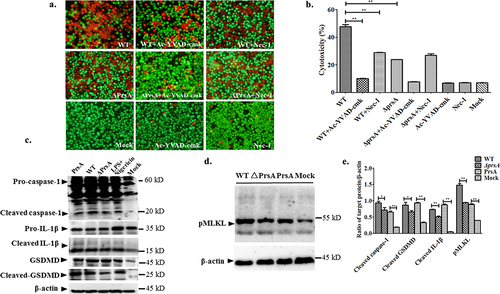
Figure 6. PrsA flanking N- and C-terminal but not enzymatic PPIase domains were essential for PrsA function in inducing cell death and inflammation. a. Amino acid regions of three fragments of PrsA truncated proteins of PPIase, NP, and PC. b. Prokaryotic expression and purification of truncated PrsA proteins by SDS-PAGE. Lane 1, recombinant E. coli cell lysate from cultures before IPTG induction; Lane 2, e. coli cell lysate from IPTG-induced cultures; Lane 3, purified PrsA proteins. c. Western blotting of Lane 1 and Lane 3 of panel B using anti-His monoclonal antibody. d. Fluorescent observation of live (green) and dead (red) RAW264.7 cells treated with three truncated PrsA proteins PPI, NP, and PC at different concentrations, respectively. PrsA (200 μg/ml) and DMEM medium treatments were used as positive and negative controls. Cellular lysis buffer of triton X-100 (0.2%) was treated and considered 100% death for cytotoxicity calculation. The bar scales indicated were 50 μm. e. Evaluation of cytotoxicity induced by PrsA truncated proteins PPI, NP, and PC with LDH concentration determination kit. f. Relative mRNA levels of proinflammatory cytokines IL-1β, IL-6, and TNF-α, as determined by qPCR. The results were presented as fold induction relative to non-infected cells against β-actin gene expression using 2−Ct method. RAW264.7 cells were stimulated by 50 μg/ml of PrsA proteins, PPI, NP and PC for 4 hs. Lipopolysaccharide (LPS) was used at 400 ng/ml as a positive control. Asterisks of “*” and “**” indicated significant at P < 0.05 or P < 0.01, respectively.
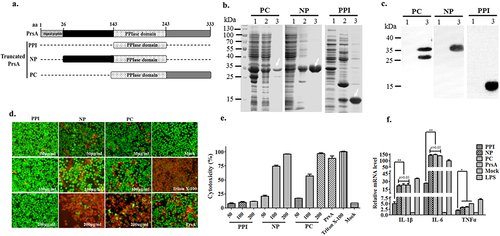
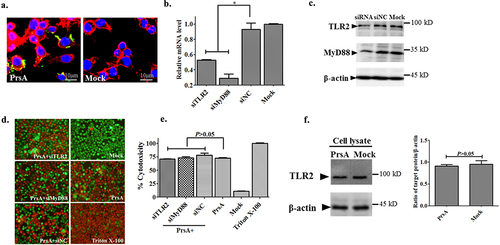
Figure 7. TLR2/MyD88 pathway was not involved in cell death induced by PrsA. a. Immunofluorescence observation of RAW264.7 cells and PrsA protein interaction. PrsA proteins were labelled with rabbit anti-PrsA poly-Ab with a second antibody Alexa Fluor 488 goat anti-rabbit Ab. Cell nuclei and cytoplasmic actin were stained with DAPI and Alexa Fluor 568 phalloidin. b. qPCR analysis of tlr2 and myd88 genes expression level in RAW264.7 after RNA interference. c. Western blotting analysis of targeted proteins expression after RNA interference. The siRNA and siNC meant specific small RNA interference molecules of TLR2, MyD88, and negative control treatment. d. Fluorescent observation of cell viability between normal RAW264.7 cells and TLR2 or MyD88 molecule downregulated cells after cytotoxic PrsA (200 μg/ml) treatment. Triton X-100 (0.2%) and DMEM medium treatments were used as positive and negative controls. e. Cytotoxicity determination with LDH release detection from the supernatants of RAW264.7 cells treated as panel d. f. Western blotting analysis of TLR2 activation after PrsA stimulation for 4hs in RAW264.7 cells as compared with PBS control. Densitometric difference of TLR2 was also analysed. The asterisk of “*” indicated significant at P < 0.05.
Data Availability statement
The authors confirmed that all data supporting the findings of this study are available within the article.