
Figures & data
Figure 1. The transcriptional landscape of S. suis oxidative response. (a) RNA-Seq analysis was performed to explore the global H2O2 stress response of S. suis. The upregulated genes are shown in green, and the downregulated genes are shown in red. The detailed information and fold change of genes shown in this figure are summarized in table 1. (b) The survival rate of WT, ΔAagp, Δexo III, ΔAguB, and ΔmetQ was determined after 25 min treated with 25 mM H2O2. The statistical analyses were performed with a two-tailed unpaired t test. “****” indicate p < 0.001.
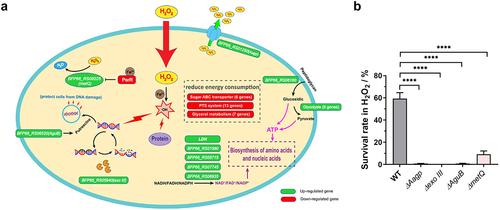
Table 1. The key differentially expressed genes under H2O2 stressa.
Figure 2. S. suis Aagp belongs to atypical aquaglyceroporins. The S. suis Aagp transmembrane helices were predicted (top panel). Asterisks specify the ar/R region residues, and black boxes mean the atypical aquaglyceroporins’ substrate-selective residues (YVPR).
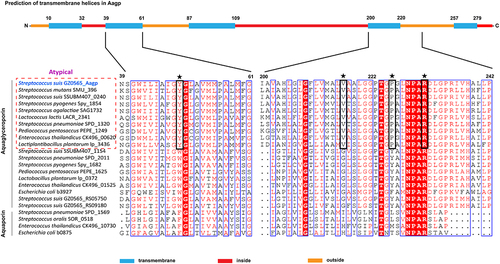
Figure 3. Aagp, a novel aquaporin, is widely distributed in S. suis. (a) The distribution of Aagp was assessed in 126 S. suis strains by examining Aagp sequences obtained from the NCBI database. (b) The survival rates of P1/7 and ΔAagpP1/7 were determined after 25 min treated with 25 mM H2O2. The statistical analyses were performed with a two-tailed unpaired t test. “**” indicate p < 0.01.
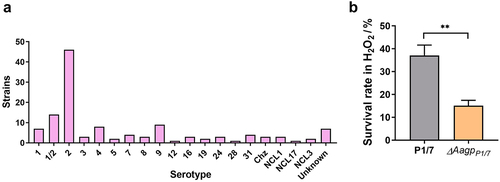
Figure 4. Aagp facilitates H2O2 efflux. (a) The survival rates of WT and ΔAagp were determined after 25 min treated with 25 mM H2O2. (b) The H2O2 concentrations of WT and ΔAagp were measured after 25 min treated with 25 mM H2O2. (c) The survival rates of WT and Aagpmut were determined after 25 min treated with 25 mM H2O2. (d) The H2O2 concentrations of WT and Aagpmut were measured after 25 min treated with 25 mM H2O2. (e) The response to H2O2 between the wild type and Aagp mutations via the Oxford cup test. The statistical analyses were performed with a two-tailed unpaired t test. “*” indicates p < 0.05 and “**” indicates p < 0.01.
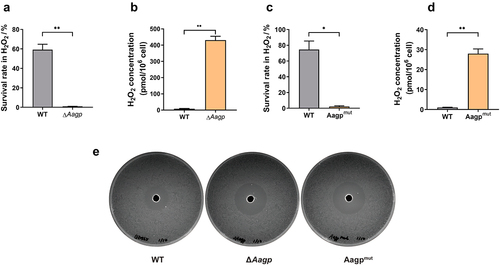
Figure 5. Aagp is involved in glycerol transport. The growth curves of WT (a) and ΔAagp (b) cultured in 1/3 THB, 1/3 THB containing 10 mM glycerol or 100 mM glycerol were shown. (c) S. suis strain GZ0565 possesses a phosphorylation pathway for glycerol metabolism. The downregulated genes are shown in red in H2O2 treatment compared with THB condition by RNA-Seq analysis. (d) The H2O2 concentrations of WT and ΔAagp cultured in 1/3 THB, 1/3 THB containing 10 mM glycerol or 100 mM glycerol were determined. The statistical analyses were performed with a two-tailed unpaired t test. “*” indicates p < 0.05.
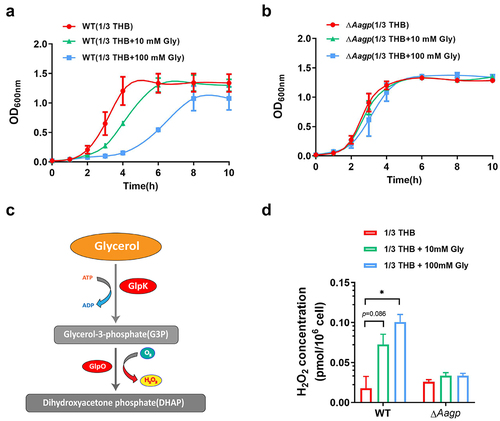
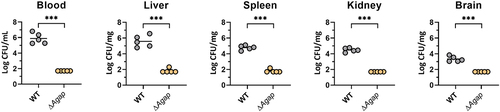
Figure 6. Aagp contributes to S. suis virulence in a mouse infection model. Five mice per group were injected intraperitoneally with 1.5 × 10⁸ CFU of WT and ΔAagp. All mice were euthanized at 24 h post-infection. Bacteria from blood, liver, spleen, kidney and brains were plated onto THA, and colonies were expressed as Log10 CFU/mg or Log10 CFU/mL. The statistical analyses were performed with a two-tailed unpaired t test. “***” indicate p < 0.001.
Supplemental Material
Download Zip (386.5 KB)Data Availability statement
The data supporting this study’s findings are available from the corresponding author upon reasonable request.