
Figures & data
Figure 1. Anti-phagocytosis by Y. pseudotuberculosis is mediated through dephosphorylation of focal adhesion kinase. HeLa cells were infected with parental Y. pseudotuberculosis or strains producing the variants of YopD at a MOI of 20 (a) Representative confocal microscopy images of uninfected or infected HeLa cells with variants of Y. pseudotuberculosis. Arrowheads (white) shows FAK (pY397) stained focal adhesions (green). Nuclei were counterstained with DAPI (blue). Scale bars = 10 μm. (b) histogram indicates quantifications of focal adhesions per cell (n = 25 cells), shown in (a). Representative data from two independent experiments is presented. Significance was determined using one-way analysis of variance (ANOVA) with Dunnett’s post-test against the parent strain of Y. pseudotuberculosis. ****p < 0.0001, ***p < 0.001, **p < 0.01, *p < 0.05. Or ns = not significant. (c) at 10 min post infection, cells were lysed and FAK from each individual lysate was immunoprecipitated using anti-FAK antibodies bound to protein G-Sepharose. Equivalent amounts of eluted material was fractionated by SDS-PAGE, and following immunoblotting, membranes were incubated with anti-Phosphotyrosine antibody, clone 4G10, and then with HRP-conjugated anti-mouse antibodies. The displayed western blot image is one experiment. The scatter dot plot beneath this image represents the quantification achieved from four independent experiments (n = 4), and represents the fold change in recovered phosphorylated FAK. The results presented are the mean value of four independent experiments. The quantification was carried out using ImageJ software. The triple asterisk (***), double asterisk (**) and single asterisk (*) reflects the degree of significant difference with p < 0.001, p < 0.01, and p < 0.05, respectively, when compared to the uninfected control. In an a parallel set of experiments, RAW 264.7 cells were infected with parental Y. pseudotuberculosis or strains producing the variants of YopD at a MOI of 20 (d). At 30 min post infection, the cells were fixed with 4% PFA. Extracellular bacteria were stained using Yersinia antisera followed by Alexa568-conjugated antibody. The cells were then permeabilized with 0.5% Triton X-100 and both extra- and intracellular bacteria were stained with Yersinia antisera followed by Alexa488-conjugated antibody. Cells were counterstained using Hoechst. For each sample, the amount of total and extracellular bacteria were counted manually using a fluorescence microscope over three independent experiments (i.e. 5 fields of view per independent experiment). The percent internalised bacteria was calculated for each field of view (n = 15) and incorporated visualization of at least 150 eukaryotic cells per sample. The double asterisk (**) and single asterisk (*) reflect on the degree of significant difference with p < 0.01 and p < 0.05, respectively, when compared to parental bacteria.
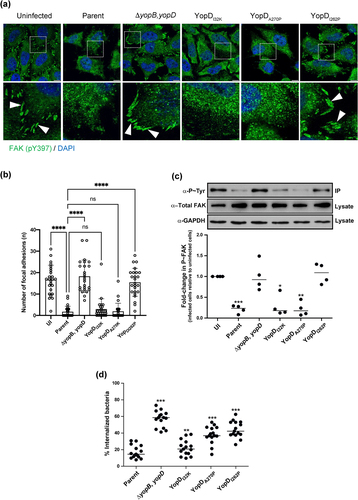
Figure 2. YopD variants control Y. pseudotuberculosis mediated suppression of p38 MAPK. RAW 264.7 macrophages were infected with parental Y. pseudotuberculosis or the ΔyopJ mutant strain at a MOI of 20 (a). At different time points post-infection (15, 30, 45, and 60 min), cells were lysed and equal amount of protein were resolved on SDS-PAGE. Active p38 was detected by western blot using phospho-p38 antibodies. Total p38 and GAPDH were used as a loading control. The displayed western blot image is one experiment. The scatter plot beneath this image represents the quantification achieved from four independent experiments (n = 4), and illustrates the time-dependent suppression of phospho-p38 by infection with parental bacteria compared to infection with the ΔyopJ mutant. In a subsequent series of experiments using the same conditions, RAW 264.7 macrophages were infected with parental Y. pseudotuberculosis, the ΔyopJ mutant strain, or strains producing variants of YopD (b). At two pre-selected time points post-infection (15 and 60 min), cells were lysed and equal amount of protein were resolved on SDS-PAGE. Active p38 was detected by western blot using phospho-p38 antibodies. Total p38 and GAPDH were used as a loading controls. The displayed western blot image is one experiment. The scatter dot plot beneath this image represents the quantification achieved from four independent experiments (n = 4), and illustrates the time-dependent suppression of phospho-p38 by infection with parental bacteria compared to infection with bacteria producing the various YopD mutants. In all cases, quantification of western blots was performed using ImageJ software. The phospho-p38 data was normalized against total p38. Significance was determined from biological replicates using a two-tailed, unpaired Student’s t-test. The double asterisk (**) and single asterisk (*) reflects the degree of significant difference with p < 0.01 and p < 0.05, respectively.
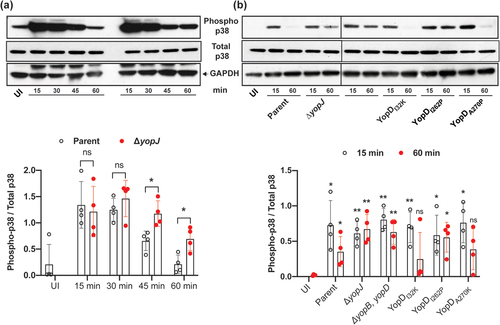
Figure 3. Y. pseudotuberculosis-mediated inhibition of p38 and NF-κB is influenced by the function of YopD. (a-b) RAW 264.7 cells were infected with parental Y. pseudotuberculosis or strains producing the variants of YopD at a MOI of 20. At 4 h post-infection, cells were fixed, permeabilized and incubated sequentially with anti phospho-p38 (a) or anti NF-κB (b) antibodies and then with AlexaFlour-488 or -568 conjugated secondary antibodies. Cells were counter-stained for nuclei with DAPI, and visualized by confocal microscopy. The dashed lines in the panel furtherest to the right in part (b) were used for calculation of Pearson coefficient for colocalization of NF-κB and DAPI. (c) The histogram to the left indicates quantification of phospho-p38 staining intensity of the uninfected and infected RAW 264.7 cells. (d) The histogram to the right indicates quantification of nuclear NF-κB staining intensity of the uninfected and infected RAW 264.7 cells. The quantification was carried out using ImageJ software. Data points indicate fluorescence intensity for randomly selected cells from two independent experiments (n = 50 cells). Histogram show mean ± S.D. Significance was determined from replicates using a one-way analysis of variance (ANOVA) with Dunnett’s post-test against cells infected with parent strain of Y. pseudotuberculosis. ****p < 0.0001, *p < 0.05. Or ns = not significant. Scale bars = 20 μm.
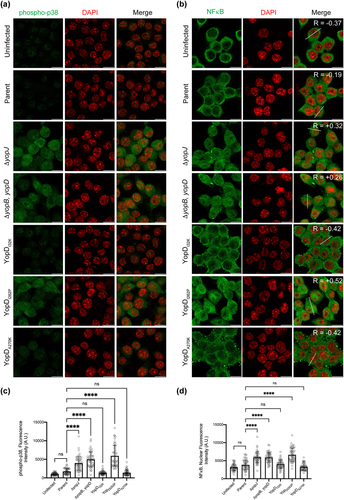
Figure 4. Kinetics of RAW 264.7 macrophage cell death induced by Y. pseudotuberculosis. RAW 264.7 macrophages were infected with parental Y. pseudotuberculosis or strains producing variants of YopD at a MOI of 20 at different time points. Cell death was quantified by the Trypan blue exclusion assay (a) or the LDH release assay (b). For the Trypan blue exclusion assay, cells were microscopically evaluated after being overlaid with 2% Trypan blue (n ≥ 500 cells in a total of 10 microscopic field fields of view). For the LDH release assay, 50 μl of cell supernatants were transferred to a flat bottom 96-well ELISA plate. A 50 μl reaction mix was added to each well and plate was incubated at room temperature in the dark for 30 min then LDH released from the cells was evaluated using a TECAN plate reader (n = 6). The ΔyopB, yopD null mutant, and the YopDI262P point mutant were less able to induce cell death when compared to all other strains including parental bacteria. The pan-caspase inhibitor, z-VAD reduced LDH release from macrophage cells exposed to parental bacteria or the YopDI32K or YopDA270P point mutants (c). In this case, cell monolayers were pre-incubated with 25 μM z-VAD for 2 h and then infected with bacteria at a MOI of 20. After 7 h post-infection, the extent of LDH released assessed (n = 3). Significance was determined from biological replicates using a two-tailed, unpaired Student’s t-test. The triple asterisk (***), double asterisk (**), and single asterisk (*) reflect the degree of significant difference with p < 0.001, p < 0.01, and p < 0.05, respectively.
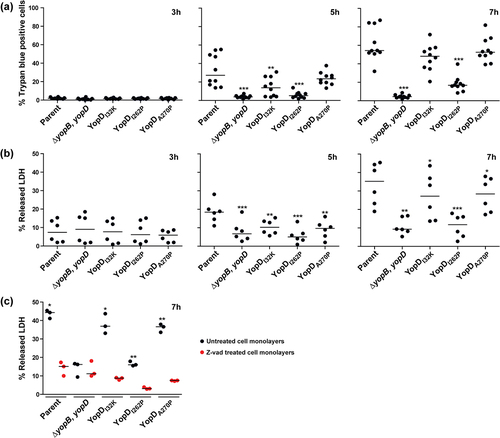
Figure 5. Macrophage cytokine production profiles that are able to distinguish between mutant strains of Y. pseudotuberculosis. RAW 264.7 cells were infected with different strains of Y. pseudotuberculosis at a MOI of 20. Cleared culture supernatants were collected after 4 h post infection, then quantified for cytokine production using the Q-Plex mouse cytokine-Screen (16-plex). Differential cytokine expression profiles in response to stimulation conditions are clearly visible using a scatter plot representation, with each circle representing an independent data point and the mean value shown as a horizontal line (n = 12). Black circles are primary control conditions represented by uninfected cells (UI), and cells exposed to either 1 µg/ml purified E. coli lipopolysaccharide (LPS) or to Y. pseudotuberculosis YPIII that has been cured of the virulence plasmid encoding for the Ysc-Yop T3SS (PC). Blue circles are cells exposed to parental Y. pseudotuberculosis or strains producing variants of YopD that still contain a full repertoire of immune-modulatory Yop effectors. Red circles are cells exposed to isogenic parental Y. pseudotuberculosis or strains producing variants of YopD that are devoid of all plasmid-encoded immune-modulatory Yop effectors (designated as multiple yop mutants – MYM). Significance was determined from biological replicates using a two-tailed, unpaired Student’s t-test. The triple asterisk (***), double asterisk (**), and single asterisk (*) reflect the degree of significant difference with p < 0.001, p < 0.01, and p < 0.05, respectively. For the most part, the significance asterisks are relative to the untreated cells.
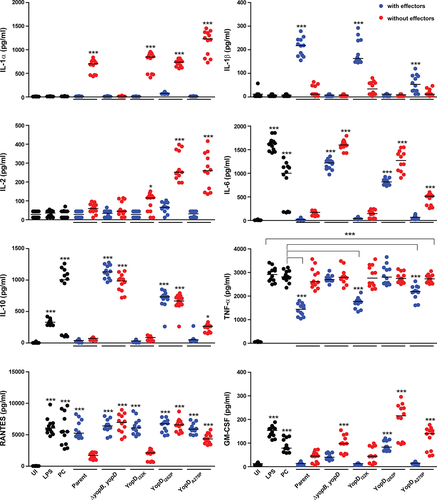
Figure 6. Multivariate analysis of cytokine profiles from RAW 264.7 cells exposed to effector positive Y. pseudotuberculosis. (a) Scores (t1/t2) plot for the PCA model (N = 60, K = 16, 2 comp., R2X(cum) = 0.477, Q2(cum) = 0.229) fitted for the five strains WT (YPIII/pIB102), YopBD (YPIII/pIB619 lacking yopB and yopD), YopDI32K (YPIII/pIB60501 with yopD containing the codon substitution I32K), YopDI262P (YPIII/pIB63301 with yopD containing the codon substitution I262P), and YopDA270P (YPIII/pIB63304 with yopD containing the codon substitution A270P). It was observed that the main structure in data differentiated the WT, YopDI32K, and YopDA270P samples from the YopBD and YopDI262P samples. (b) The corresponding loadings (p1/p2) plot for the PCA model in Figure 5. The cytokines ending up with a common covariance pattern were colored referring to the positions in the loadings plot. It was observed that IL-6, IL-10, and GM-CSF (red coloring) were highly correlated and could be linked to the observed groupings in Figure 5, indicating in higher concentrations for both YopDB and YopDI262P. Also, IL-1β (green coloring) indicated to separate the two observed groups based upon higher concentrations for WT, YopDI32K, and YopDA270P.
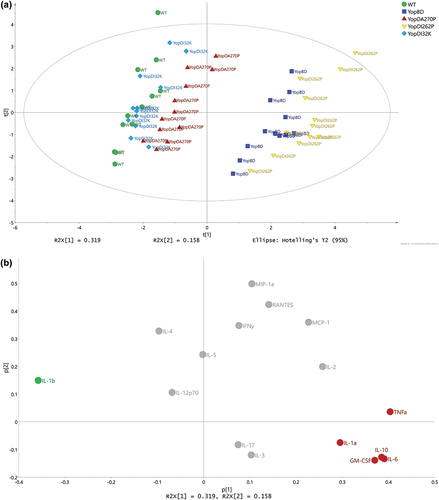
Figure 7. Multivariate analysis of cytokine profiles from RAW 264.7 cells exposed to Y. pseudotuberculosis strains lacking the translocated effectors. (a) Scores (t1/t2) plot for the PCA model (N = 60, K = 16, 2 comp., UV-scaled, R2X(cum) = 0.459, Q2(cum) = 0.134) fitted for the five multiple yop mutant (MYM – lacking yopH, yopM, yopE, yopK, yopJ, and ypkA) strains – WTMYM (YPIII/pIB29MEKJA – parent), YopBDMYM (YPIII/pIB29MEKJABD – MYM also lacking yopB and yopD), YopDI32KMYM (YPIII/pIB29MEKJA60501 – MYM with yopD containing the codon substitution I32K), YopDI262PMYM (YPIII/pIB29MEKJA63301 – MYM with yopD containing the codon substitution I262P), and YopDA270PMYM (YPIII/pIB29MEKJA63304 – MYM with yopD containing the codon substitution A270P). It was observed that the main structure in data differentiated the WTMYM, YopDI32KMYM, and YopDA270PMYM samples from the YopBDMYM and YopDI262PMYM samples. (b) The corresponding loadings (p1/p2) plot for the PCA model in Figure 6a. The cytokines ending up with a common covariance pattern were colored referring to the positions in the loadings plot. It was observed that IL-6, IL-10, and RANTES (red coloring) were highly correlated and could be linked to the observed groupings in Figure 6a, indicating in higher concentrations for both YopBDMYM and YopDI262PMYM. Also, IL-1α and IL-1β (green coloring) indicated to separate the two observed groups based upon higher concentrations for WTMYM, YopDI32KMYM, and YopDA270PMYM.
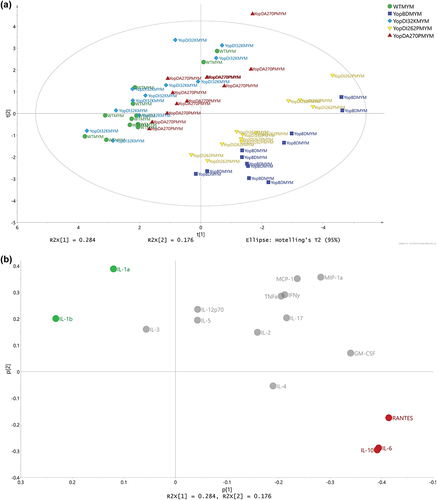
Figure 8. Using multivariate analysis to compare cytokine profiles from RAW 264.7 cells exposed to Yersinia strains with or without the translocated effectors. (a) Scores (t1/t2) plot for the PCA model (N = 5, K = 16, 2 comp., non-treatment, R2X(cum) = 0.926, Q2(cum) = 0.695) fitted for the effect profiles generated by OPLS-DA modelling, one model per strain against its corresponding multiple yop mutant (MYM). For each strain, an OPLS-DA model was fitted in order to separate the two treatments (i.e. strains with and without the Yop effectors) and the resulting predictive loadings (pp) represented the overall effect between the two treatments. It was obvious that the WT, YopDI32K, and YopDA270P strains presented with a highly similar effect respective to the presence or absence of the Yop effectors. It was also apparent that the effect for YopDI262P relative to the presence and absence of Yop effectors was neither similar to the YopBD strain nor similar to the other three strains. (b) The corresponding loadings (p1/p2) plot for the PCA model shown in Figure 7a. The coloring of cytokines was made corresponding to the trends in effects due to the presence and absence of Yop effectors. It was observed that IL-1α, IL-1β, IL-10, RANTES, and TNFα (red coloring) were clearly linked to similarities between the WT, YopDI32K, and YopDA270P strains, relative to the YopBD and YopDI262P strains. Also, due to the orthogonal directions in the plot, it was observed that IL-2, IL-6, and GM-CSF (green coloring) indicated that the highly similar WT, YopDI32K, and YopDA270P strains were not identical.
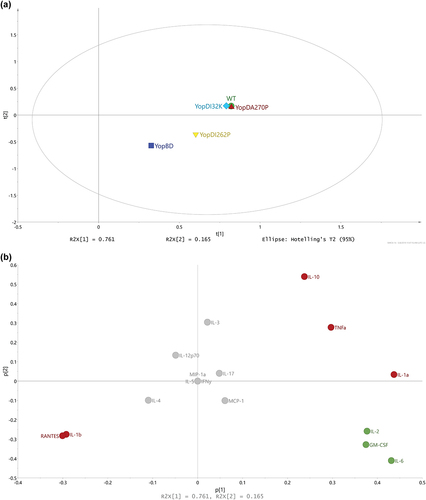
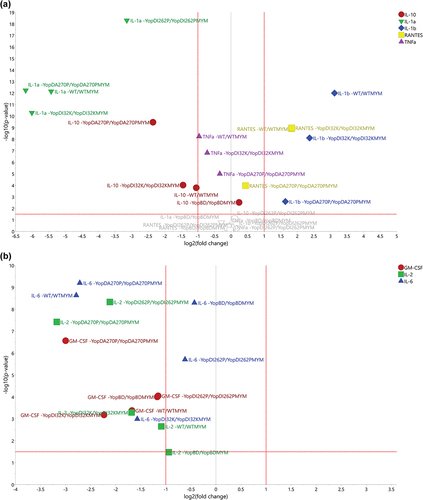
Figure 9. Using volcano plots to compare the fold-change of specific cytokine responses to bacteria with or without effectors). The volcano plots were generated for the distinct treatment effects colored red (a) and green (b) as visualized in Figure 8b. The y-axis refers to the independent t-tests (p-values) and the threshold was set at the 5% significance level (α = 0.05), referring to the treatment effects for each strain and cytokine. The x-axis refers to the corresponding fold change values (effect of the presence of Yop effectors divided by the effect of the absence of Yop effectors). (a) It was obvious that the strains WT, YopDI32K, and YopDA270P indicated clear Yop effector-dependent treatment effects for IL-1α, IL-1β, IL-10, RANTES, and TNFα. It was also noticeable that IL-1α, IL-10, and TNFα ended up with negative fold changes, i.e. a boost in the particular cytokine response due to the loss of Yop effectors, while IL-1β and RANTES ended up with positive fold changes due to the loss of Yop effectors lessening the particular cytokine response. The strain YopDI262P indicated a clear treatment effect only for IL-1α, while the strain YopBD indicated only a small treatment effect for IL-10. In contrast, in (b) we observe that the cytokines IL-2, IL-6, and GM-CSF could distinguish between the effector positive and effector negative strains within the WT, YopDI32K, and YopDA270P backgrounds. In particular, IL-2 and GM-CSF distinguishes the YopDA270P background from WT and YopDI32K, whereas IL-6 separates the YopDI32K background from WT and YopDA270P.
Supplemental Material
Download MS Word (1.8 MB)Data Availability statement
The authors confirm that the data supporting the findings of this study are available within the article and its supplementary material, and are available from the corresponding author on reasonable request.