
Figures & data
Table 1. List of primers used in this study.
Figure 1. Npro interacts with CALCOCO2. (a) the Npro-CALCOCO2 interaction was detected using the yeast two-hybrid system. The yeast strain co-transformed with BD-P53 and AD-T (P53/T) served as a positive control. BD-Npro/AD (Npro/AD) and BD/AD-CALCOCO2 (BD/CALCOCO2) were used to exclude self-activation. Cotransformation of Lam/T and BD/AD was used as a negative control. All yeasts co-transformed with the described constructs were screened on SD/-2 (SD/-Leu/-Trp) and SD/-4 (SD/-ade/-his/-Leu/-Trp) plates. (b, c) GST pull-down assay of CALCOCO2 and Npro. Purified GST, GST-Npro, or GST-CALCOCO2 proteins were bound to magnetic beads. The beads were then incubated with recombinant Flag or HA-tagged proteins expressed in HEK293T cells. The bound proteins were washed completely and subjected to western blotting using a rabbit anti-Flag mAb, a rabbit anti-HA mAb, or a rabbit anti-GST pAb. (d) HEK293T cells were co-transfected with HA-Npro and Flag-CALCOCO2 or Flag-EV. At 48 h post-transfection, HA-Npro immunoprecipitation was performed using the anti-Flag-tag mAb-magnetic beads, followed by immunoblot analysis with anti-Flag and anti-HA antibodies.
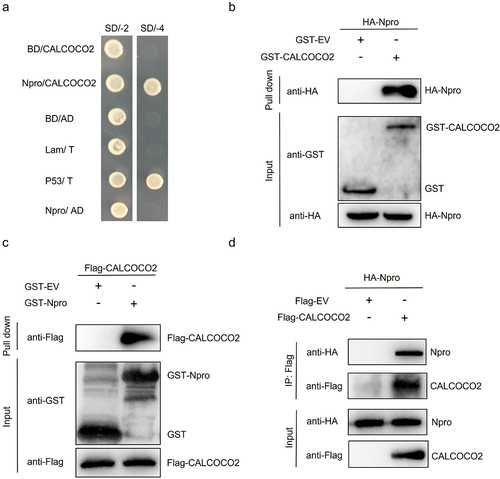
Figure 2. CALCOCO2 promotes BVDV replication. (a) immunoblot analysis of CALCOCO2 protein expression in the MDBK cell line stably overexpressing CALCOCO2 using anti-CALCOCO2 and anti-GAPDH antibodies. (b) the mRNA levels of CALCOCO2 were analyzed through qPCR in cells that had stable overexpression of CALCOCO2. (c, d) CALCOCO2-overexpressing cell lines were infected with BVDV (MOI = 0.1 or 1) and harvested at 48 h post-infection. (c) the mRNA levels of BVDV Npro were analyzed through qPCR in CALCOCO2-overexpressing cells. (d) the TCID50 assay was used to determine the virus titers of BVDV in the cell cultures. (e) CALCOCO2 protein levels were analyzed through immunoblotting in stable CALCOCO2-knockdown cell lines. (f) the knockdown efficiencies of CALCOCO2-silenced MDBK cells were examined by immunoblot analysis. (g) the mRNA levels of the Npro gene were analyzed through qPCR in stable CALCOCO2-knockdown cell lines at 48 h post-infection. (h) the viral titers of BVDV-infected CALCOCO2-knockdown or control cells were determined by TCID50 at 48 h post-infection. The means and standard deviation from three independent experiments are shown. P values were calculated by Student’s t test in B,C and D and by one-way ANOVA in F, G and H: *, P < 0.05; **, P < 0.01.
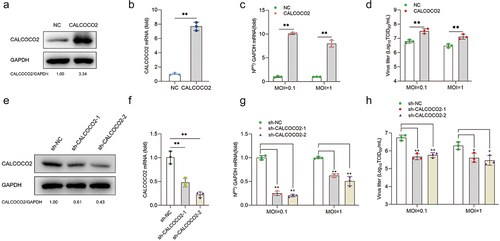
Figure 3. CALCOCO2 restrains the expression of IFN-β and ISGs during BVDV infection. (a, b) a and b represent the qPCR analysis of IFN-β, MX1, ISG15, and OAS1 mRNA levels in CALCOCO2-overexpressing cells infected with BVDV (MOI = 0.1 or 5). c and d show the IFN-β, OAS1, MX1, and ISG15 mRNA levels in CALCOCO2 knockdown cells and control cells at 24 h after BVDV infection (MOI = 0.1 or 5). The relative mRNA levels of IFN-β and ISGs were normalized to GAPDH. The mean and SD values were determined from three independent experiments. P values were calculated by Student’s t test in a and B and by one-way ANOVA in c and d: **, P < 0.01; and ns indicates insignificant.
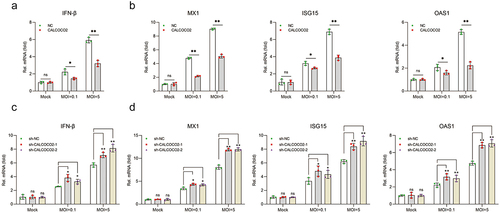
Figure 4. CALCOCO2 promotes the degradation of IRF3. (a) the protein levels of IRF3 in CALCOCO2-overexpressing cells infected with BVDV were detected at 24 and 48 hpi. (b) at 24 and 48 h post-infection, the mRNA levels of IRF3 were analysed through qPCR in both CALCOCO2-overexpressing MDBK cells and control cells. GAPDH mRNA levels served as an internal reference control. Data are shown as the mean ± SD (ns, not significant). (c). Immunoblot analysis of IRF3 protein levels in CALCOCO2-overexpressing and control cells treated with the proteasome inhibitor MG132 (0.5 μM) or DMSO for 4 h followed by infection with BVDV (MOI = 5) for 24 h.
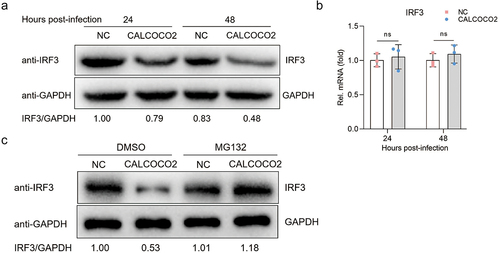
Figure 5. CALCOCO2 promotes Npro-mediated ubiquitination of IRF3 by interacting with IRF3. (a) HEK293T cells were co-transfected with HA-Npro, Flag-IRF3, Ub-myc, GFP-CALCOCO2, or GFP-EV and treated with 0.50 μM MG132. Anti-Flag-tag mAb-magnetic beads were used to perform IP on the cell lysates, which were subsequently analysed through immunoblotting using anti-Flag, anti-HA, anti-GFP, and anti-Ub antibodies. (b) HEK293T cells were co-transfected with Flag-IRF3 and HA-CALCOCO2 or HA-EV, followed by co-IP and immunoblot analysis of the interactions of Flag-IRF3 with HA-CALCOCO2 using the anti-HA-tag mAb-magnetic beads, anti-Flag, and anti-HA antibodies. (c) co-IP and immunoblot analysis using anti-Flag-tag mAb-magnetic beads on extracts of HEK293T cells transfected with HA-CALCOCO2 and Flag-IRF3 or Flag-EV.
Data Availability statement
The data supporting this study’s findings are available from the corresponding author.