Figures & data
Figure 1. Trio activates endogenous Rac1 (a) Schematic overview of the TrioFL protein. TrioN encodes the N-terminal region, including the GEF1 domain. TrioC represents the C-terminus of Trio including the GEF2 domain and TrioGEF1 represents the GEF1 domain including an SH3 domain. (b) HEK293T cells were transfected with GFP-TrioGEF1, TrioN or TrioFL as indicated and active Rac1 (Rac1.Gtp) levels were determined. Western blot analysis showed that all Trio constructs activate endogenous Rac1. (c) HEK293T cells were transfected as indicated and active Rac1 levels were determined. Western blot analysis showed that TrioN activates endogenous Rac1 independently of TrioC. Input: Upper panel shows expression of Trio constructs. Lower panels show expression of Rac1 in total cell lysates. (b) and (c) Quantification of endogenous Rac1 levels; the values were normalized to the active Rac1 level in HEK293T cells transfected with GFP. Data are mean + SEM of three independent experiments. *P<.05; **p < 0.01.
Figure 2. Pervanadate does not trigger Rac1 activation. (a) HEK293T cells were transfected and treated with pervanadate as indicated. No increase in Rac1.GTP loading is detected for any of the Trio constructs after pervanadate treatment. Lower panels show input and pY staining shows efficient pervanadate treatment. Actin was used as a loading control. Quantification of endogenous Rac1 levels; the values were normalized to the active Rac1 level in HEK293T cells transfected with GFP. Data are mean + SEM of three independent experiments. *P<.05. (b) SILAC-based mass spectrometry analysis of thrombin-treated HUVEC showed a significant increase (*p < 0.01) in serine phosphorylation on Trio residues S1785 and S1786, compared to serine residues (S2455 and S2459 or S2477) that remained unphosphorylated. The y-axis indicates fold increase in serine phosphorylation and drawing of Trio FL shows location of the 2 serine residues, in between the two exchange domains. Schematic drawing shows the location of the two serine residues in between the two GEF domains.
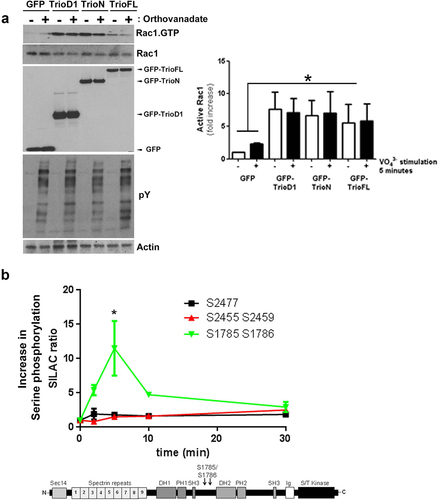
Figure 3. Serine phosphorylated Trio induces linear junctions. (a) Western blot analysis showed reduced Rac1.GTP and RhoG.GTP levels in HEK293 cells that were transfected with the phosphomimetic Trio mutant (GFP-TrioFL-DD). Quantification graph shows no significant increase in Rac1.GTP levels between WT and DD mutant. Experiment is carried out 5 times. *p < 0.01. (b) GST-Rac1-G15A (nucleotide-free Rac1 mutant) pulldown shows increased binding of the phosphomimetic mutant of Trio, compared to the Trio-WT. Input shows loading control. Experiment is done twice.
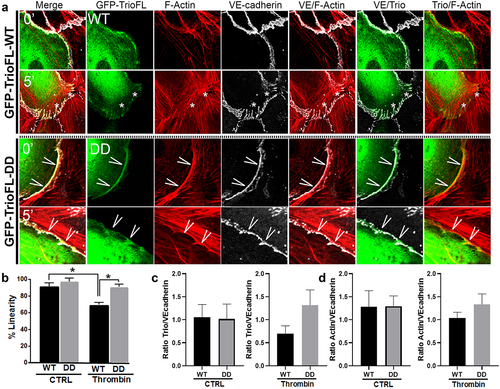
Figure 4. Phosphomimetic TrioFL-DD mutant reduces thrombin-induced Focal Adherens Junctions. HUVECs were transfected with GFP-tagged TrioFL-WT (a) or TrioFL-DD (phosphomimetic) mutant (b) as indicated. Cells were stimulated with thrombin (1 U/mL) for 5, 30 or 60 minutes or left unstimulated and then fixed, permeabilized and stained for VE-cadherin (white) and F-actin in red. ROIs (Regions of interest) show detailed phenotype of endothelial cell-cell junctions. Jagged phenotype corresponds to FAJ (focal adherence junction) phenotype. Scale bars are 20 μm (Merge) or 10 μm (Zoom).
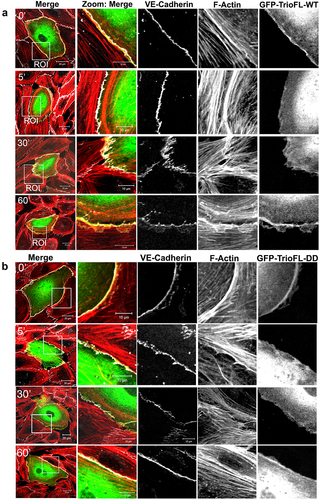
Figure 5. Phosphomimetic TrioFL-DD mutant co-localizes with VE-cadherin. (a) HUVECs were transfected with GFP-tagged TrioFL-WT or TrioFL-DD (phosphomimetic) mutant as indicated. Cells were treated with thrombin (1 U/mL) for five minutes and then fixed, permeabilized and stained for VE-cadherin (white) and F-actin in red. (b) Quantification of junctional linearity in TrioFL-WT and Trio-DD expressing cells before and after thrombin treatment. Experiment is carried out three times. Data are mean ± SEM. *p < 0.05. (c) the ratio between F-actin and GFP-TrioFL-WT or the DD mutant was quantified upon control (CTRL) or after 5 minutes of thrombin treatment. At least 10 cells expressing Trio constructs were analysed independently from each other. (d) the ratio between VE-cadherin and GFP-TrioFL-WT or the DD mutant was quantified upon control (CTRL) or after 5 minutes of thrombin treatment. At least 10 cells expressing Trio constructs were analysed independently from each other.