Figures & data
Figure 1. Anti-dJmj and H3K27me3 immunofluorescence analyses in wild-type Drosophila testes from spermatogonium to late growth stage. (A, G, M) Staining of spermatocytes with DAPI. (B, H, N, N″) Immunostaining of testes with the anti-dJmj antibody. (E, K, Q, Q″) Immunostaining of testes with the anti-H3K27me3 antibody. (M′″) Immunostaining of testes with the anti-Fibrillarin antibody. (D, J, P, P,″ N″′) Phase contrast images of spermatocytes. (C, I, O, O″) Merged DAPI staining with anti-dJmj staining images are shown. (F, L, R, R″) Merged DAPI staining with anti-H3K27me3 staining images are shown. (O″′) Merged anti-Fiblirallin staining with Phase contrast images are shown. (A-F) spermatogonium, (G-L) early growth stage, (M-R, M″–R,″ M″′–O″′) late growth stage. (A′–R′) Magnified images of each stage. (M″–R″) Immunostaining of spermatocytes in the early growth stage without 1st antibody. (M′–R′, M″′–O″′) A nucleus is encircled by solid line and a nucleolus is by dashed line. (K, L), (Q, R) the other cyst from (G-J), (M-P). Scale bars = 50 μm (G-R, M″–R″), 10 μm (A-F), 0.1μm (A′–F′, G′–R′, M″′–O′″).
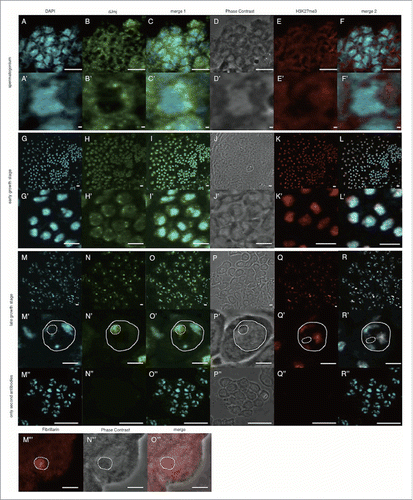
Figure 2. Anti-dJmj and H3K27me3 immunofluorescence analyses in wild-type Drosophila testes from onion stage to canoe stage. (A, G, M) Staining of spermatids with DAPI. (B, H, N) Immunostaining of testes with the anti-dJmj antibody. (E, K, Q) Immunostaining of testes with the anti-H3K27me3 antibody. (D, J, P) Phase contrast images of spermatocytes. (C, I, O) Merged DAPI staining with anti-dJmj staining images are shown. (F, L, R) Merged DAPI staining with anti-H3K27me3 staining images are shown. (A-F) onion stage, (G-L) elongation stage, (M-R) canoe stage. (A′–R′) Magnified images of each stage. (A′–F′) A spermatid is encircled by solid line. A nucleus is encircled by right dashed line and a nebenkern is by left dashed line. (Q, R) the other cyst from (M-P). Scale bars = 50 μm (A-R), 0.1 μm (A′–F′).
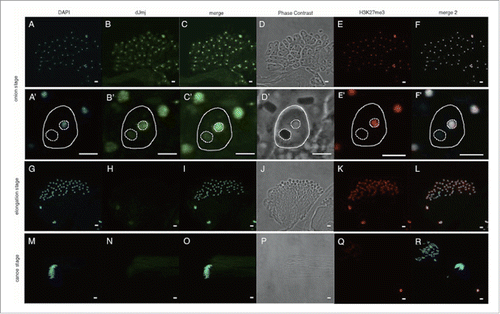
Figure 3. Localization of dJmj to the nucleolus in wild-type and PcG mutant lines at late growth stage. (A, C, E, G, I) Phase contrast images of spermatocytes. (B, D, F, H, J) Immunostaining of testes with the anti-dJmj antibody. (A, B) wild-type, (C, D) esc1 : + ; esc1/SM5 ; +, (E, F) ScmET50 : + ; + ; ScmET50/TM3, (G, H) Psc1 : + ; Psc1/CyO ; +, (I, J) ph-d504 : ph-d504/FM7c ; + ; +. (A′–J′) Magnified images of (A-J). (A′–J′) A nucleolus is encircled by dashed line. Scale bar = 50 μm (A-J), 0.1μm (A′–J′).
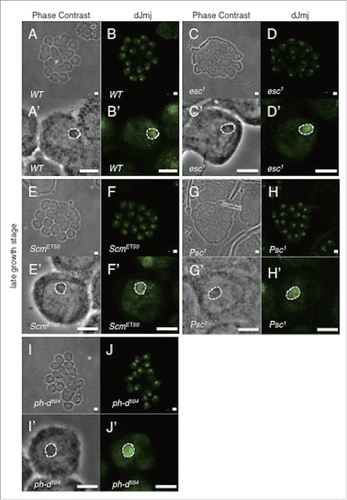
Figure 4. Localization of dJmj to the nucleus in PcG mutant lines. (A, C, E, G) Phase contrast images of spermatocytes at late growth stage. (B, D, F, H) Immunostaining of testes with the anti-dJmj antibody. (A, B) Pc1 : + ; + ; Pc1/TM1, (C, D) Su(z)123 : + ; + ; Su(z)123/TM6B, (E, F) E(z)731 : w ; + ; E(z)731/TM6C, (G, H) E(z)EY21318 : yw ; + ; E(z)EY21318, (I, J) Kdm236Y : w ; + ; Kdm236Y, (A′–J′) Magnified images of (A-J). (A′–H′) A nucleolus is encircled by dashed line. Scale bar = 50 μm (A-H, I, J), 1 μm (I′, J′), 0.1 μm (A′–H′).
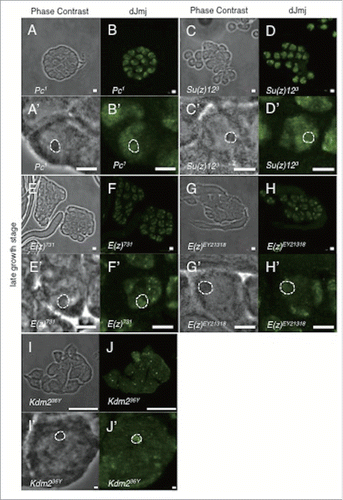
Figure 5. Quantitative analyses of dJmj localization, expression level and nucleolus size in PcG mutant lines at late growth stage. (A) Quantification of dJmj ‘Noisiness’ signals. ‘Noisiness’ is the value which divided average intensity of nuclei by standard deviation of intensity. PcG mutant lines that represent in pink bars were localized to nucleolus. Other mutant lines that represented in blue bar were spread throughout the nucleus. (B) Relative intensity of dJmj signals in the nucleolus. Intensity of dJmj signals in PcG mutant lines was relative to that in wild-type that was scored as 1. (C) Relative size of nucleolus. Average nucleolus size of wild-type was 311.5 μm2. Nucleolus sizes of PcG mutant lines were relative to those of wild-type which were scored as 1. The dJmj signals in PcG mutant lines represented in pink bars were localized to nucleolus. The dJmj signals in other mutant lines represented in blue bars were spread throughout the nucleus. Means of 50 independent measurements on 3 independent preparations are shown. Error bars represent SE. *P < 0.001.
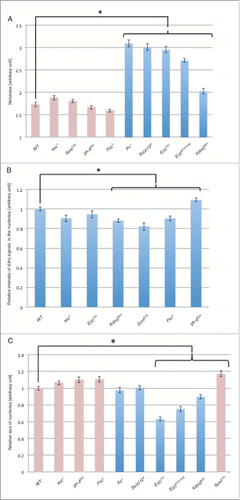
Figure 6. dJmj localization in tTAF mutant line at the late growth stage. (A, E) Staining of spermatocytes with DAPI. (B, F) Immunostaining of testes with the anti-dJmj antibody. (C, G) Merged images are shown. (D, H) Phase contrast images of spermatocytes, (A-D) wild-type male spermatocytes, (E-H) spermatocytes from tTAF mutant line (sa1/TM6B). (A′–H′) Magnified images of each stage. (A′–H′) A nucleus is indicated by arrow and a nucleolus is encircled by dashed line. Scale bar = 10 μm (A-H), 1μm (A′–H′). (I) Quantification of dJmj Noisiness signals in tTAF mutant line. Wild-type that represent in pink bar was localized to nucleolus. tTAF mutant line that represented in blue bar was spread throughout the nucleus. Means of 50 independent measurements on 3 independent preparations are shown. Error bars represent SE. *P < 0.01.
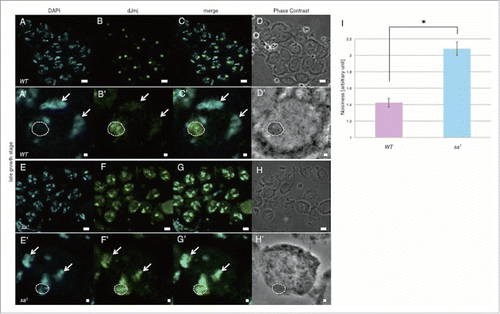
Figure 7. Pc does not interact with dJmj in the early growth stage. (A-E) Positive control (Pc-GFP line), anti-Pc and anti-GFP antibodies were used for 1st antibodies. (F-J) Sample (Pc-GFP line), anti-dJmj and anti-GFP antibodies were used. (K-O) negative control (wild-type), anti-Pc and anti-GFP antibodies were used. (A, F, K) Staining of spermatocytes with DAPI, (B, G, L) PLA signals, (C, H, M) Merged DAPI staining with PLA signals images are shown. (E, J, O) Merged PLA signals with Phase contrast images are shown. (D, I, N) Phase contrast images of spermatocytes, (A′–O′) Magnified images of (A-O), Scale bar = 10 μm.
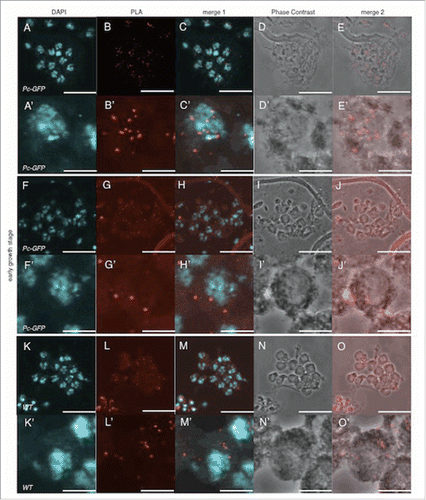
Figure 8. Signals that represent the interaction between Pc and dJmj in the late growth stage. (A-E) Positive control (Pc-GFP line), anti-Pc and anti-GFP antibodies were used for 1st antibodies. (F-J) Sample (Pc-GFP line), anti-dJmj and anti-GFP antibodies were used. (K-O) negative control (wild-type), anti-Pc and anti-GFP antibodies were used. (A, F, K) Staining of spermatocytes with DAPI, (B, G, L) PLA signals, (C, H, M) Merged DAPI staining with PLA signals images are shown. (E, J, O) Merged PLA signals with Phase contrast images are shown. (D, I, N) Phase contrast images of spermatocytes, (A′–O′) Magnified images of (A-O). (B′–E′, G′–J′, L′–O′) A nucleolus is encircled by dashed line. Scale bar = 10 μm.
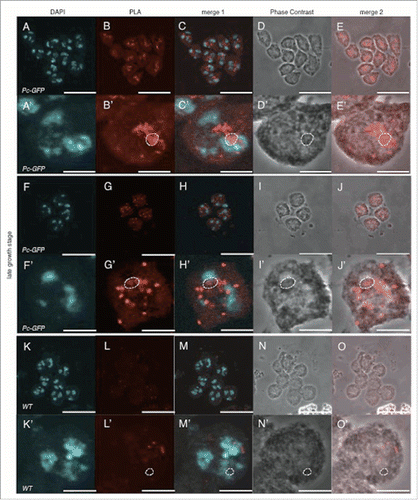
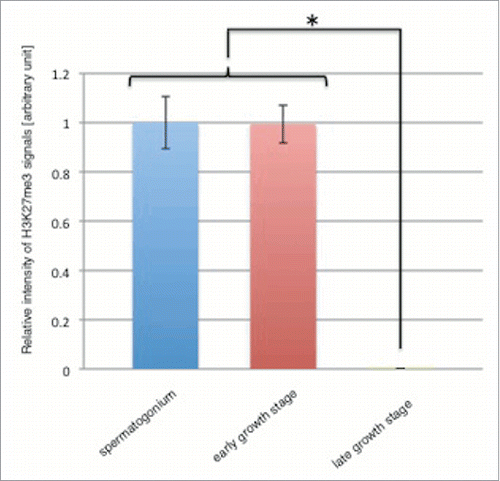
Figure 9. H3K27me3 level decreases in the late growth stage. Relative intensity of H3K27me3 signals in spermatogonium (blue bar), early growth stage (red bar) and late growth stage (green bar) are shown. Intensity of H3K27me3 signals in the growth stage was relative to that in spermatogonium that was scored as 1. Means of 49 independent measurements on 3 independent preparations are shown. Error bars represent SE. *P < 0.001.