1,745
Views
0
CrossRef citations to date
0
Altmetric
Research Paper

Agents and networks to model the dynamic interactions of intracellular transport

ORCID Icon, ORCID Icon, , &
Article: e1392401 | Received 28 Sep 2017, Accepted 10 Oct 2017, Published online: 29 Nov 2017

Figures & data

Table 1. Gunawardena definitions for formal and informal model.

Figure 1. ABM simulation of intracellular transport modeled in NetLogo. The ABM “rules” for fusion and fission are described in.Citation28 In brief, three endocytic compartments carrying different Rab membrane domains were modeled. Each compartment is formed by several individual organelles (tubules and vesicles, represented by rectangles and circles in the right and middle panels). The organelles move randomly (or along microtubules, yellow straight lines) in the 2D space. Two nearby organelles can fuse if they carry compatible domains. An organelle can divide forming a tubule and a vesicle, or generate an internal vesicle if it contains enough membrane for these topological transformation. Rabs membrane domains change composition by series of reactions involving cytosolic Rabs. At step 0, a soluble and a membrane bound markers were loaded in the Rab A compartment. Left panel. Snapshot after 8380 steps. In each step, organelles have the opportunity of moving, fusing, dividing, forming an internal vesicles, and changing Rab composition. The color of each organelle (tubule or vesicle) represents its Rab content: Rab A (green), Rab B (red) and Rab C (blue). The resulting color depends on the relative amount of these proteins on the membranes. For example, the large organelle at the bottom is enriched in Rab C. Middle panel. Same simulation at step 8385. Color code was changed to reflect the content of the fluid phase (green) or the membrane-associated (red) markers. Notice that the soluble marker is concentrated in the large organelle labeled with Rab C and that the membrane-associated marker is limited to small tubules. Black organelles lack soluble or membrane markers. Plasma membrane is at the top and nucleus at the bottom. The width of the gray square at the left bottom correspond to 100 nm. Numbers in brackets indicate the amount of internal vesicles of each organelle. Right panel. The graph shows the distribution of the fluid phase marker (in arbitrary units) associated with Rab A (green), Rab B (red) and Rab C (blue) organelles along the simulation. Notice that the marker is initially in Rab A structures; along the simulation it is transferred to other organelles and finally concentrates in Rab C structures.
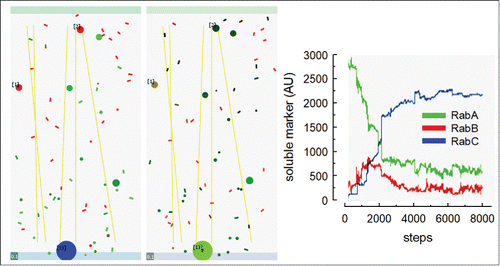
Figure 1. ABM simulation of intracellular transport modeled in NetLogo. The ABM “rules” for fusion and fission are described in.Citation28 In brief, three endocytic compartments carrying different Rab membrane domains were modeled. Each compartment is formed by several individual organelles (tubules and vesicles, represented by rectangles and circles in the right and middle panels). The organelles move randomly (or along microtubules, yellow straight lines) in the 2D space. Two nearby organelles can fuse if they carry compatible domains. An organelle can divide forming a tubule and a vesicle, or generate an internal vesicle if it contains enough membrane for these topological transformation. Rabs membrane domains change composition by series of reactions involving cytosolic Rabs. At step 0, a soluble and a membrane bound markers were loaded in the Rab A compartment. Left panel. Snapshot after 8380 steps. In each step, organelles have the opportunity of moving, fusing, dividing, forming an internal vesicles, and changing Rab composition. The color of each organelle (tubule or vesicle) represents its Rab content: Rab A (green), Rab B (red) and Rab C (blue). The resulting color depends on the relative amount of these proteins on the membranes. For example, the large organelle at the bottom is enriched in Rab C. Middle panel. Same simulation at step 8385. Color code was changed to reflect the content of the fluid phase (green) or the membrane-associated (red) markers. Notice that the soluble marker is concentrated in the large organelle labeled with Rab C and that the membrane-associated marker is limited to small tubules. Black organelles lack soluble or membrane markers. Plasma membrane is at the top and nucleus at the bottom. The width of the gray square at the left bottom correspond to 100 nm. Numbers in brackets indicate the amount of internal vesicles of each organelle. Right panel. The graph shows the distribution of the fluid phase marker (in arbitrary units) associated with Rab A (green), Rab B (red) and Rab C (blue) organelles along the simulation. Notice that the marker is initially in Rab A structures; along the simulation it is transferred to other organelles and finally concentrates in Rab C structures.

Reprints and Corporate Permissions

Please note: Selecting permissions does not provide access to the full text of the article, please see our help page How do I view content?

To request a reprint or corporate permissions for this article, please click on the relevant link below:

Academic Permissions

Please note: Selecting permissions does not provide access to the full text of the article, please see our help page How do I view content?

Obtain permissions instantly via Rightslink by clicking on the button below:

If you are unable to obtain permissions via Rightslink, please complete and submit this Permissions form. For more information, please visit our Permissions help page.