
Figures & data
Figure 1. Waste oil treatment in EU 28 countries in 2018 (based on Stahl and Merz Citation2020). Regeneration: includes exports for regeneration. Incineration: takes place in cement and lime kilns and industrial boilers. Other: includes exports. Note that the accounting of waste oil quantities and regeneration rates can differ between countries. Some countries feature regeneration rates of 100%. However, evidence suggests that such high regeneration rates are in many cases artefacts of accounting, as some countries report the initial sediment and water separately from dry waste oils and others report only on the regeneration of waste oil of sufficient quality (García-Gutiérrez et al. Citation2023; Le Bihan et al. Citation2021; RDC Environment Citation2023). Country abbreviations follow the two-letter ISO 3166 alpha-2 code, except for Greece, which is abbreviated as ‘EL' and the United Kingdom, which is abbreviated as ‘UK'.
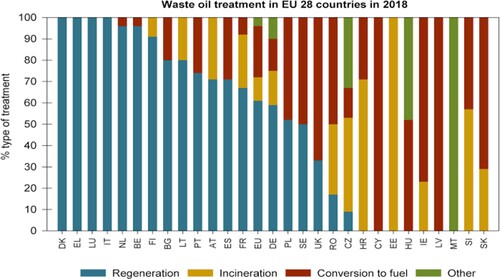
Table 1. The different policies analysed in this article.
Figure 2. The effect of a quantity target on the base oil market. Left panel: SAgg is the aggregated supply of regenerated and virgin base oil (in blue). D is the aggregate demand curve (in red). The market equilibrium is given by the intersection of the aggregate supply curve and the demand curve in the point (Q0,P0), where a quantity of Q0 is sold at price P0. Right panel: A quantity target increases the supply of regenerated base oil SRG (in green) from q0 to q1. The equilibrium (Q0,P0) is the same as in the left panel. According to the regenerators’ supply curve (SRG), they sell the quantity q0 << Q0 at price P0. If a policy (such as the 70% regeneration target) would increase the amount of regenerated base oil sold on the market from q0 to q1, regenerators face higher costs and would need to sell at p1. However, as the equilibrium price is at P0 regenerators need a cost compensation of at least the area corresponding to the pink triangle in the right panel.
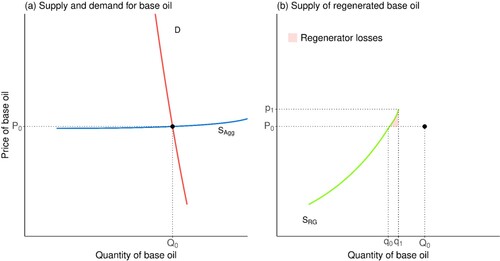
Figure 3. The effect of a subsidy (left panel) and a levy (right panel) on the base oil market. SAgg represents the aggregate supply curve (in blue), which is the sum of the virgin refiners’ and the regenerators’ supply curves. For illustrative purposes, the regenerators’ supply curve SRG is also shown separately (in green). D is the demand curve (in red). Left panel: The effect of a subsidy for regeneration on the ratio of regenerated to virgin-based base oil. The supply curve for regenerators is shifted to the right (from SRG to SRG’), but the aggregated supply curve (SAgg) hardly shifts, due to the much larger volume of virgin base oil (we therefore do not include a shifted aggregate supply curve in the left panel). Right panel: The effect of a levy on virgin base oil on aggregate base oil supply. The aggregated supply curve (SAgg) shifts upwards (to S’Agg) due to the increased cost for virgin refiners, making additional regeneration profitable for regenerators, as they can sell at a higher price. Policy 2a is illustrated in the left panel, while policy 2b is illustrated by the sum of the effects displayed in both panels.
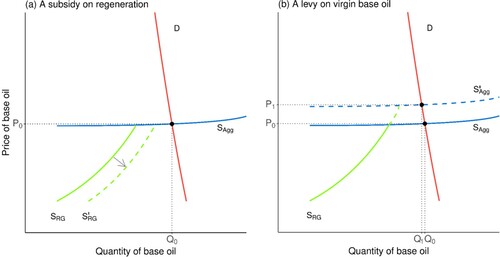
Figure 4. Regenerated (RG) waste oil (WO): policy versus business-as-usual (BAU).
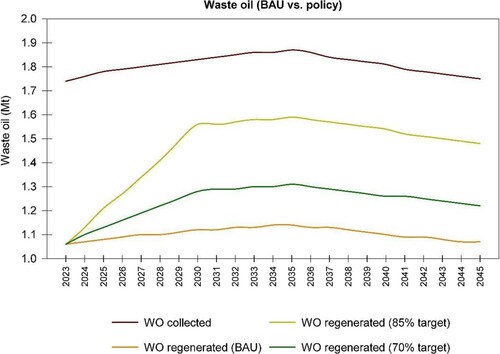
Figure 5. Waste oil regeneration facilities in the EU-27 (absolute number). Source: Stahl and Merz (Citation2020).
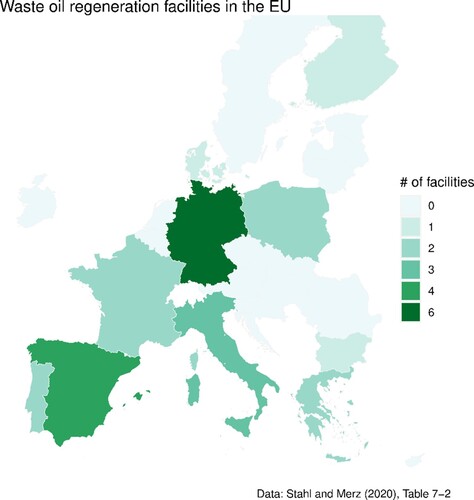
Figure 6. Free regeneration capacities in the EU as a percentage of the total spare capacity. Country abbreviations follow the two-letter ISO 3166 alpha-2 code, except for Greece, which is abbreviated as ‘EL' and the United Kingdom, which is abbreviated as ‘UK'.
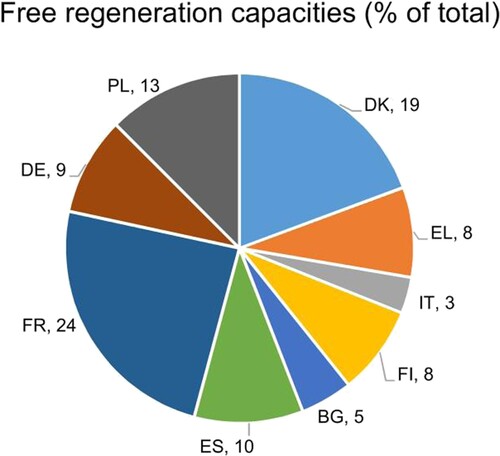
Figure 7. Employment effects of 70% and 85% regeneration targets in terms of FTEs in 2045 for different EU countries. We assume that the regeneration target set in policy 2a shifts waste oil from waste oil-based fuel producers to regenerators in countries with spare regeneration capacities. FTEs by 2045 can roughly be interpreted as the number of jobs lost over the course of the period 2024–2045. Top panel: 70% regeneration target. Bottom panel: 85% regeneration target. FTE: full-time equivalent; RG: regenerated; WODF: waste oil derived fuel. Country abbreviations follow the two-letter ISO 3166 alpha-2 code, except for Greece, which is abbreviated as ‘EL' and the United Kingdom, which is abbreviated as ‘UK'.
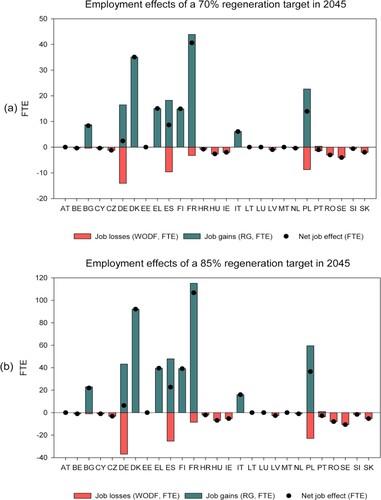
Table 2. Summary of environmental, economic and social impacts for regeneration rates of 70% and 85% of all collected waste oil (sLCC = societal life cycle cost; FTE = full time equivalent).
Table 3. Comparison of environmental, economic, and social effects of the different policies until 2045 at EU level. All monetary values are given in 2024 NPV.