
Figures & data
Table 1. Data sources.
Table 2. Demographic characteristics of the study sample (N = 9,053).
Table 3. Rural-urban differences in ECD outcomes.
Figure 1. Prevalence of delay (n = 14,807).
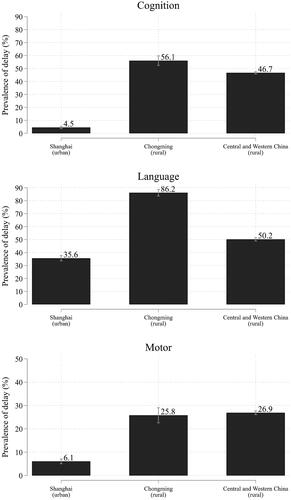
Figure 2. Mean ECD scores and prevalence of delay over age (in rural sample from Western China; n = 1,801).
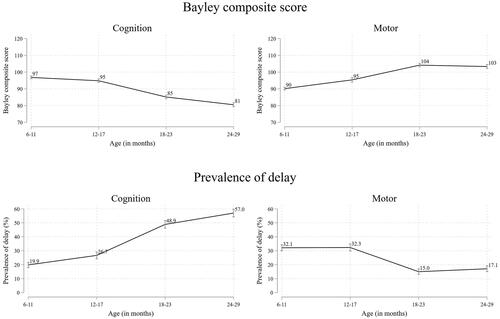
Table 4. Differences in ECD outcomes based on child and household characteristics.
Figure 3. Mean ECD scores over age by subgroup (in rural sample from Western China; n = 1,801).
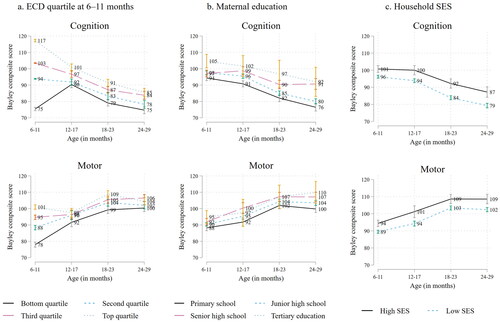
Figure 4. Summary of regression analyses testing for treatment impacts of parental training program on ECD outcomes, parenting beliefs, and parental investment. Note. This figure presents ITT effects of cluster-randomized parenting experiments on ECD outcomes, parenting beliefs, and parental investment. The dependent variables are expressed in standardized z-scores (with a mean of 0 and SD of 1). The ITT effects are estimated using an ANCOVA specification. We control for the outcome variable of interest at baseline, control covariates, and study, cohort, and province fixed effects. Standard errors are clustered at the village-level.
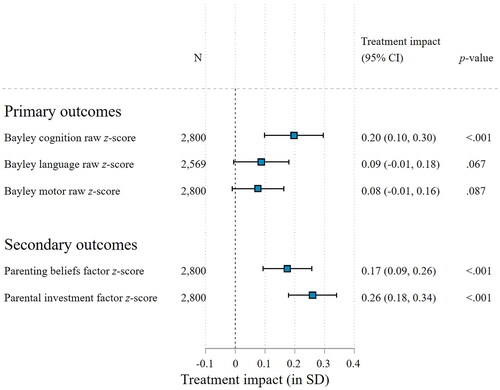
Table 5. Mediation analysis of impacts of parental training programs on ECD outcomes (in rural areas of Central and Western China).
Table 6. Breakdown of total program impacts on ECD outcomes.
Figure A.1. Scree plots of the eigenvalues of the principal components of parenting beliefs and parental investment.
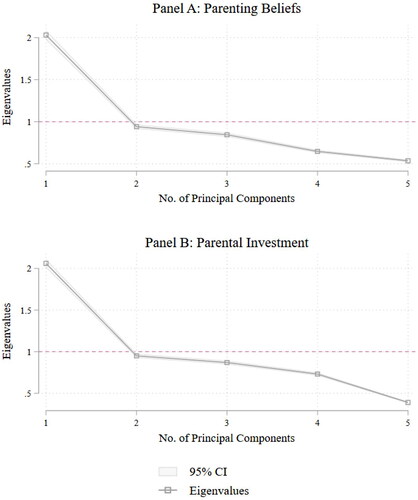
Table A.1. Exploratory factor analysis to determine the number of latent factors.
Table A.2. Estimated factor loadings and communality.
Figure B.1. Trial profiles of the three intervention studies. Note: In the home visitation program in Shaanxi Province, 79 caregiver-child dyads in treatment group villages were randomly assigned to control at the individual level. As shown in Sylvia et al. (Citation2021), no evidence was detected of spillover effects of the parenting intervention on child development or parenting outcomes of the untreated households in treatment group villages. In addition, in the study in Panel A, the Griffith Mental Development Scales were administered instead of the Bayley scales to assess ECD outcomes of n = 300 children. This subsample is excluded from the evaluation sample.
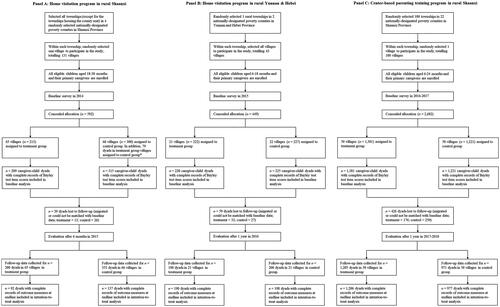
Table B.1. Baseline characteristics by study arm.
Table B.2. Baseline characteristics of stayers by study arm.