Figures & data
Table 1. Types of multi-level governance.
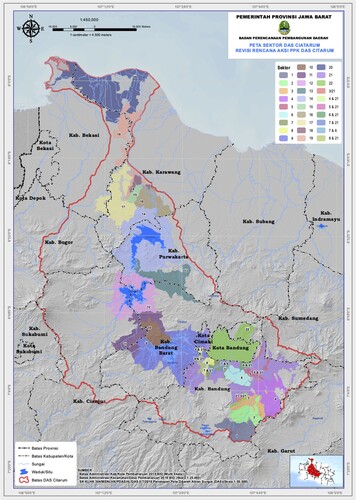
Figure 1. Research design.
A diagram showing the embedded qualitative case design consisting of data collection conducted for the main case context of national and provincial programme level (indicated by a larger box) and two embedded units in Cimahi City and Bandung Regency (indicated by two smaller boxes inside the larger box). Data collection methods include interviews, participatory workshops and secondary documentation. This data collection period was subsequently followed by two data analysis phases (indicated by downward arrows going from data collection to analysis), including Phase 1 – coding and Phase 2 – thematic aggregation & explanations building.
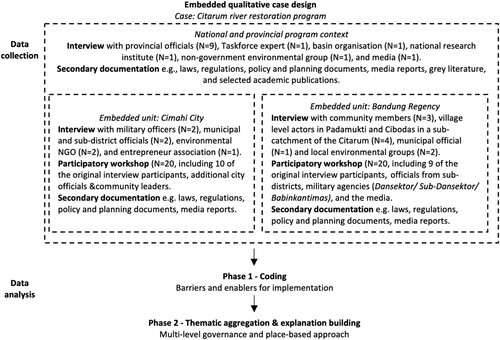
Figure 2. Locations of embedded cases: Cimahi City and Bandung Regency (red lines show administrative boundaries).
Source: Google (2024) Cimahi City and Bandung Regency. Available at https://maps.google.com.
A map showing the geographical locations and administrative boundaries of Cimahi City and Bandung Regency within West Java Province. The side by side map also shows the much larger size of Bandung Regency in comparison to Cimahi City, whilst providing a sense that the latter is far more urbanised (indicated by predominantly gray colour of built up areas in the map).
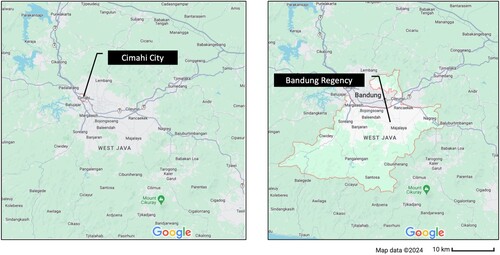
Figure 3. Formal coordination structure of the Citarum Taskforce.
Source: Adapted from Citarum Taskforce coordination and implementation directives outlined in Presidential Regulation No.15/2018 and Citarum Action Plan 2019–2025.
An organisational diagram showing the hierarchical structure and coordinating lines between the national government, the Taskforce, the military commanders, the police force and the cities/regions and villages.
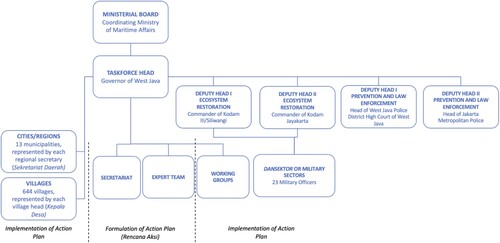
Table 2. Connecting multi-level governance with place-based conditions.
Figure 4 Military sectors in Citarum.
Source: Citarum Taskforce, Citation2021.
A map of Citarum catchment overlaid by 22 military sectors running along the entire river body from upstream in the Cisanti head region (south) down to the downstream low lying area in Karawang (north).