Figures & data
Figure 1. Example illustrating survival regression by data fusion (DFMF-SR). The left pane shows the data fusion graph. Nodes in the fusion graph correspond to different types of objects considered by the system. Edges represent data matrices that describe relationships between objects of different types. For example, rows of matrix ("A," "E") correspond to objects "A" and columns agree with objects of type "E." A designated node "S" in the square box serves for the times of the events. Matrix ("A," "S") contains patient survival data. It is a binary matrix indicating the times when the respective objects of type "A" experienced the event. Type "A" most often corresponds to patients or tumor samples and hence ("A," "S") encodes the amount of time that has passed from primary diagnosis until a patient's death. DFMF-SR naturally interleaves collective matrix factorization with estimation of survival regression coefficients. The right pane shows the latent data model inferred by DFMF-SR. Each matrix with gray entries identifies a mapping from objects to their respective latent factors, which are stored in matrix columns. The number of matrices with blue entries is the same as the number of data sets; each one stores pairwise relations between latent factors as supported by the corresponding data set. The matrix with entries colored in different shades of red holds time-varying survival regression coefficients.
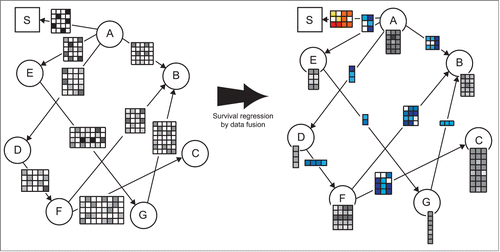
Figure 2. Example illustrating the use of latent factors from matrix tri-factorization for survival model estimation in DFMF-SR. Let us assume data matrix ("A," "E") was selected as a data set whose latent factors are used in the survival model. In each iteration of DFMF-SR, current tri-factorization of ("A," "E") is updated toward both better reconstruction of the matrix ("A," "E") and improved accuracy of the survival model. Parametrization of the survival model is given by vectors with red and orange entries. Since DFMF-SR builds upon Aalen's additive model, the number of vectors corresponds to the number of time points in the survival data. Each vector holds information about the importance of any latent factor for survival up to the respective time point. The dimensionality of each vector corresponds to the number of latent factors in ("A," "E"), i.e., the number of columns in the matrix with blue entries, plus one. An additional entry in each vector is reserved for the time-varying baseline hazard for survival.
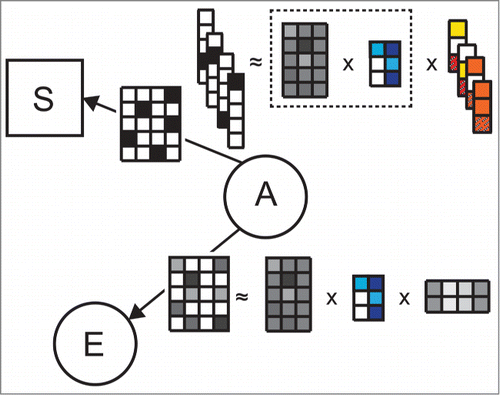
Table 1. Cross-validated error of predicted survival time. Latent data representations of protein expression values or somatic mutation data are regressed against patient survival data for 3 different cancer studies. We compare our approach (DFMF-SR) to a procedure, which first infers predictive factors by data fusion (DFMF in Step I) or principal component analysis (PCA in Step I) and then learns a regression model (Aalen in Step II). Aalen's regression modeling could be in principal applied to raw data (first row without feature construction in Step I), but fails due to high dimensionality of data sets
Figure 3. Cumulative hazard plots produced by DFMF-SR showing (a) the cumulative hazards of selected somatic mutation latent factors, i.e., B*i (tk) of latent factor i for times tk of the events, and (b) the baseline hazard in the HNSC cancer study. Notice that regression coefficients are the derivatives of the cumulative hazards and so it is the slopes of the plots that are informative.
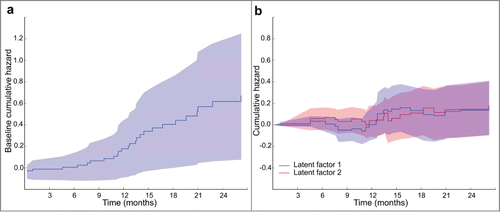
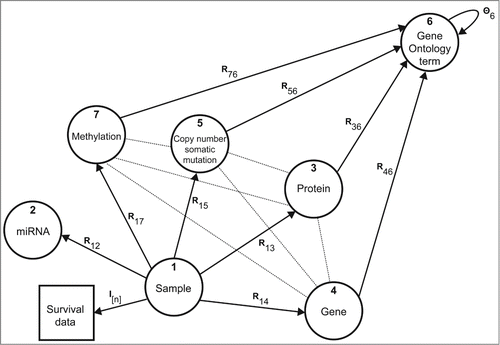
Figure 4. Data sources and their relations. Nodes in the graph correspond to different types of objects and edges denote data matrices Rij or constraint matrices Θi. For example, matrix R13 contains protein expression values, R15 relates tissue samples to mutated genes in the tumor, and DNA methylation matrix R17 reports on gene-based methylation Beta values of interrogated sites. Gene annotations from Gene Ontology are given in matrices Rx6, x ∈ {3, 4, 5, 7}. Constraint matrix Θ6 encodes the semantic similarity of Gene Ontology terms as defined by the directed acyclic graph of the ontology.