Figures & data
Figure 1. Set-up isometric view (a) without the exposure chamber and (b) with the exposure chamber.
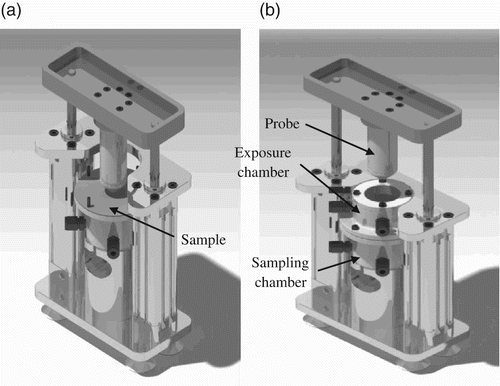
Figure 2. (a) Schematic representation of the variation of the sample deformation as a function of time during a dynamic deformation event and (b) schema of a conical-spherical probe head.
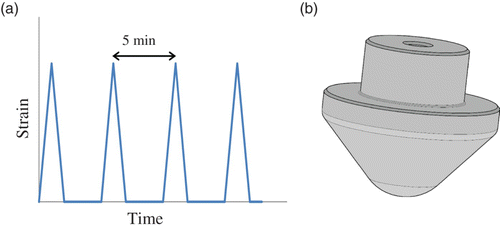
Figure 3. TEM image of the nTiO2 powder.
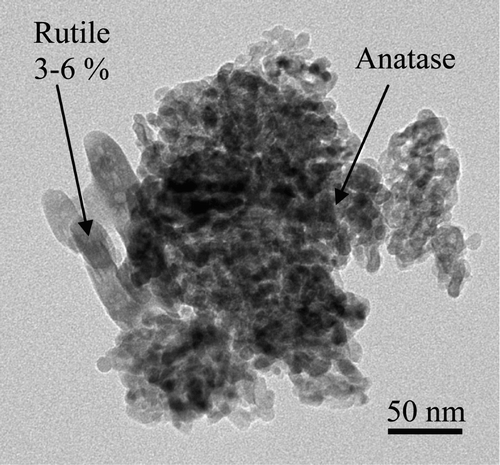
Figure 4. Size distribution of the nTiO2 powder.
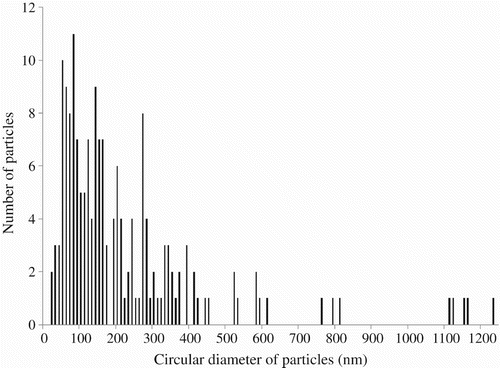
Figure 5. (a) SEM images of the surfaces of nitrile rubber, (b) butyl rubber, (c) PE–PP non-woven coverall and (d) laboratory coat.
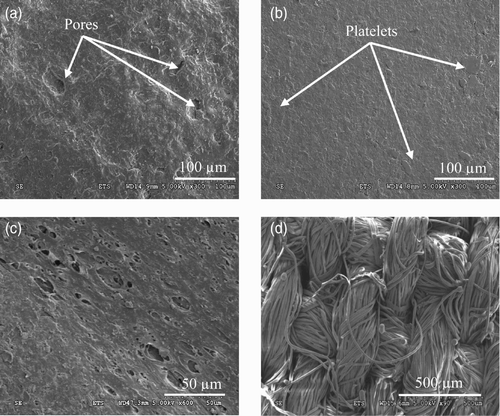
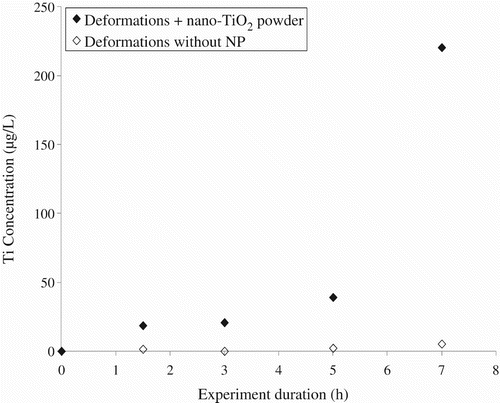
Figure 6. Variation in concentration of titanium in the sampling solutions as a function of the duration of the 50% biaxial deformations for nitrile (nitrile butadiene rubber (NBR)) and butyl (isobutylene isoprene rubber (IIR)) rubber samples exposed to nTiO2 powder.
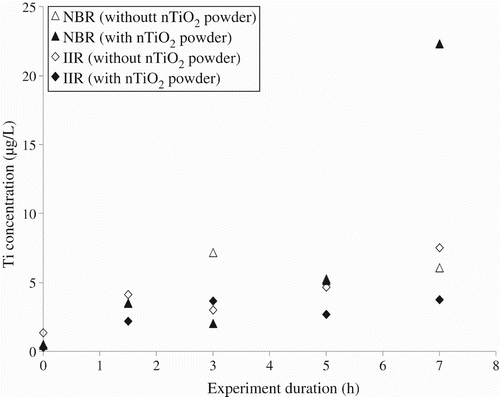
Figure 7. (a) Atomic force microscopy pictures of native mica substrate and (b) after centrifugation of the sampling solution for the 7 h dynamic biaxial deformations/nTiO2 powder/nitrile rubber condition.
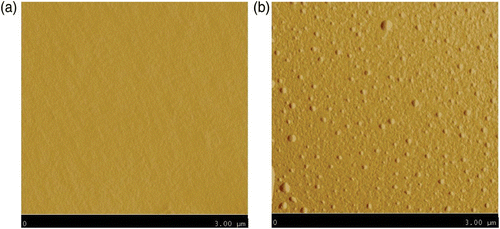
Figure 8. (a) SEM images of the nitrile rubber and (b) butyl rubber external glove surface after 7 h of dynamic biaxial deformations.
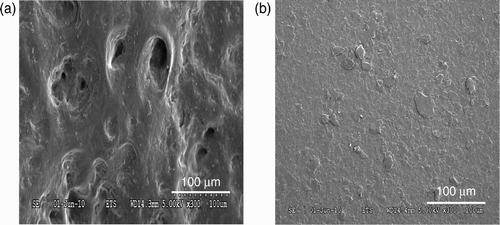
Figure 9. Variation of the surface features as a function of the duration of dynamic biaxial deformations for the nitrile and butyl rubber (outer surface).
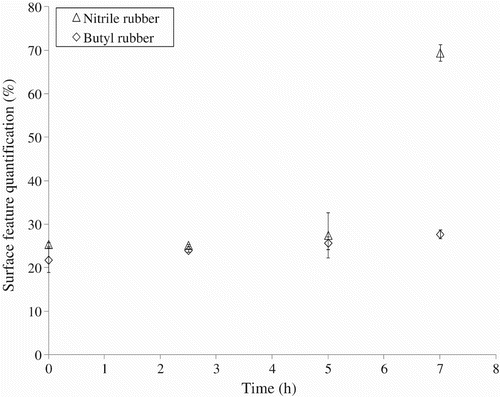
Figure 10. (a) FEG–SEM images of the nitrile rubber glove surface after 1.5 h of dynamic biaxial deformations and (b) after 7 h of dynamic biaxial deformations.
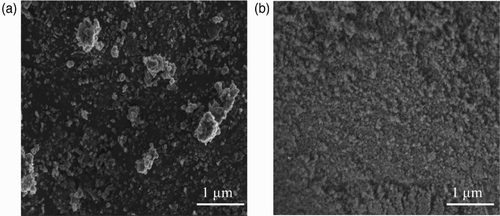
Figure 11. Variation in the concentration of titanium in the sampling solutions as a function of the duration of 50% biaxial deformations for nitrile (NBR) and butyl (IIR) rubber samples exposed to colloidal solutions of nTiO2.
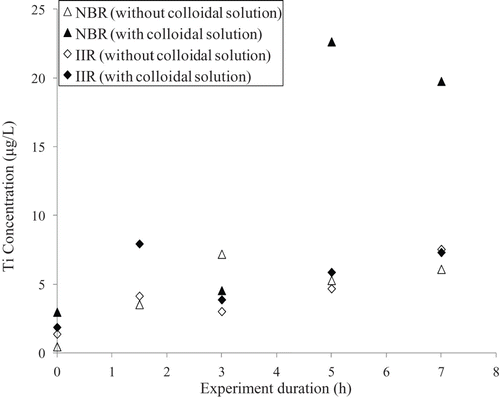
Figure 12. Effect of 7 h of exposure to 1,2-propanediol (propylene glycol (PG)), dynamic biaxial deformations and combination of both on the material-specific glove surface features for the nitrile and butyl rubber.
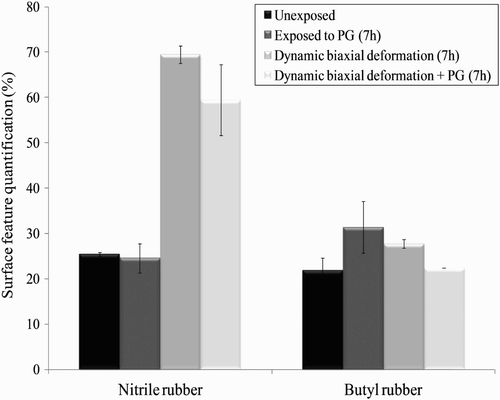
Figure 13. Mass gain of the nitrile rubber gloves as a function of immersion time in the nTiO2 solution in water and 1,2-propanediol (PG).
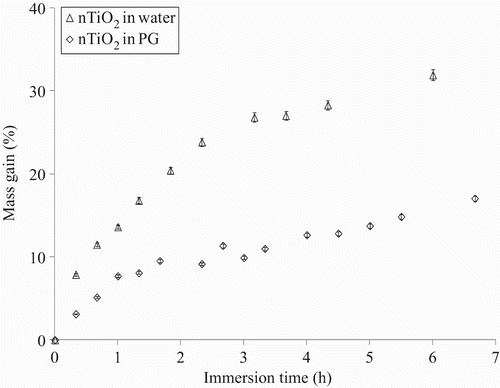
Figure 14. Mass gain as a function of immersion time in nTiO2 in water for nitrile and butyl rubber samples.
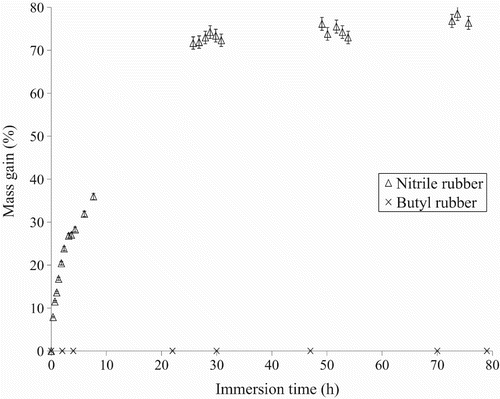
Figure 15. Titanium concentration penetrating a non-woven coverall material (PE-PP) exposed to nTiO2 and 6% biaxial deformations.
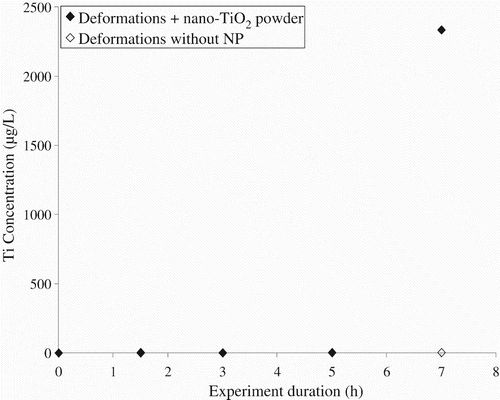
Figure 16. Titanium concentration penetrating a cotton/polyester woven fabric exposed to nTiO2 and 6% biaxial deformations.