Figures & data
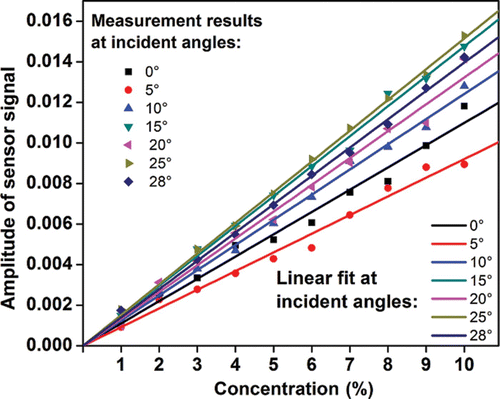
Figure 1. SEM and AFM height images of waveguided MPC structures.
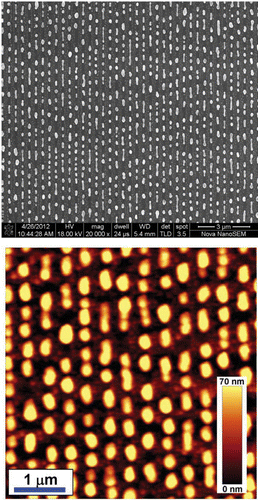
Figure 2. Optical extinction spectra for TE and TM polarizations in air, respectively.
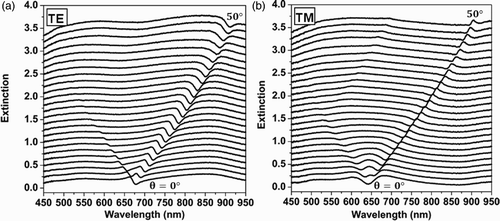
Figure 3. Schematic drawing of the experimental setup.
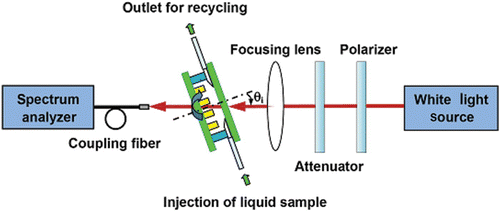
Figure 4. Schematic illustration of the definition of the sensor signal.
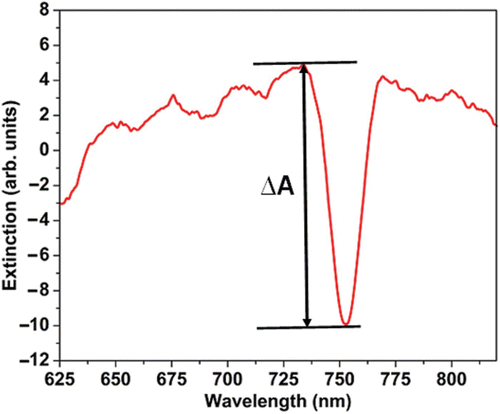
Figure 5. (a)–(g) Optical extinction spectra of glucose/water solutions with the concentration increased from 1% to 10% (W/W) using pure water as the blank sample at different incident angles: (a) 0°, (b) 5°, (c) 10°, (d) 15°, (e) 20°, (f) 25°, (g) 28°. (h) The refractive index of the glucose/water solution measured by an Abbe refractometer with the concentration increased from 1% to 10%.
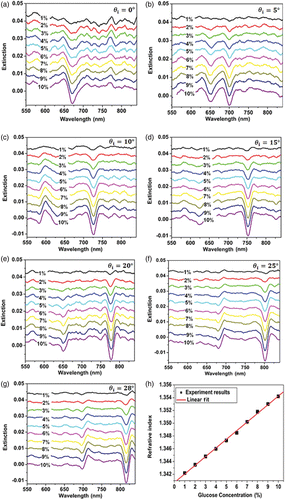
Figure 6. Measurements on the amplitude of the sensor signal as a function of the concentration of the sample solution at different angles of incidence. The solid lines show the linear fit to each group of the measurements.