Figures & data
Figure 1. Raman spectra and structure (inset) of C60 and C70 fullerenes. The Raman spectra of the two fullerenes are expected to be highly similar, given the extensive structural similarities between the two molecules. There exist a sufficiency of unique spectral features specific to the vibrational modes to readily distinguish between C60 and C70.
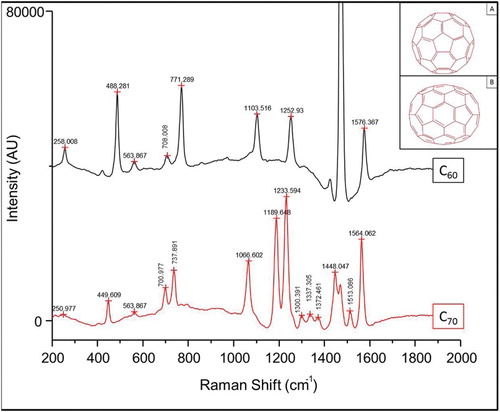
Figure 2. Raman spectra of varying mass fractions of C60 and C70 mixtures. Spectra are offset to be centered at 463.7 cm−1. The arrows indicate the direction of the change in the peaks at 447.8 and 488.3 cm−1 as the mass fraction of C70 increases from 0% to 100%. The 447.8 cm−1 band is unique to C60, and decreases as the relative mass fraction of C70 increases. The 488.3 cm−1 peak is specific to C70, and increases as the mass percent of C70 increases.
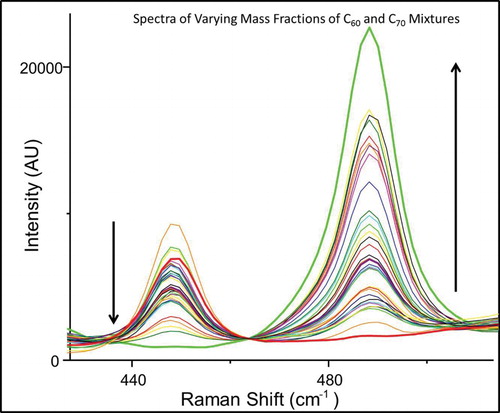
Figure 3. Ratiometric calibration curve. The ratio of the relative (to intensity 463.7 cm−1) peak intensity between the 447.8 and 488.3 cm−1 is plotted as a function of mass fraction of C70. An exponential function was fit to the data with an equation y = 0.1265e3.3989x, with an R2 value of 0.98.
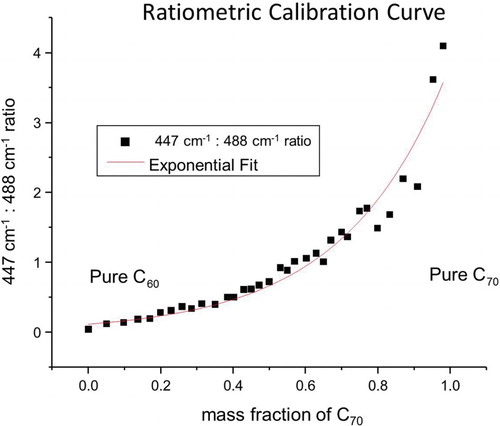
Figure 4. Spectra of fullerene mixture in the presence of graphitic carbon. Spectra were collected of a neat fullerene mixture, and after the addition of graphite to the 11% and 20% mass to simulate a carbon contaminate. The 3σ limit of detection is reached when the sample contains 20% by mass of the graphitic carbon. The peak ratios for the neat sample (0.780) agree favorably with that of the 11% by mass contaminant sample (0.730), indicating a mass fraction of 53% and 51% C70, respectively.
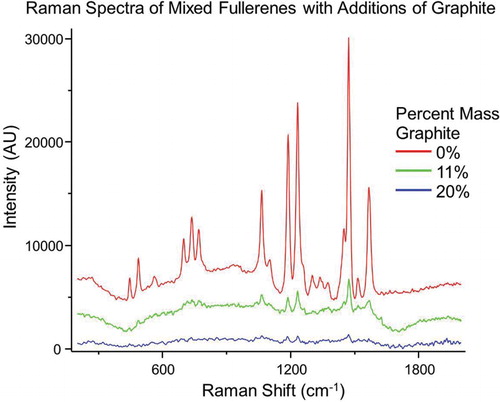
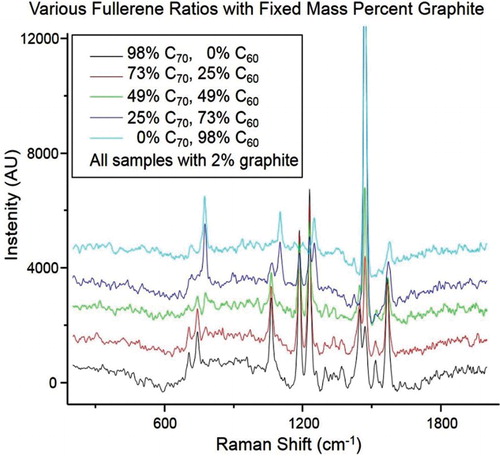
Figure 5. Spectra of various fullerene ratios in the presence of a fixed percent mass of graphitic carbon. Mass ratios of 98%, 73%, 49%, 25% and 0% C70 in the presence of 2% by mass graphite and the 0%, 25%, 49%, 73% and 98% C60 were prepared to show how the peak ratios vary with mass percent of fullerenes, even in the constant presence of a contaminant. Spectra have been offset for clarity. Peaks associated with C70 diminish and those unique to C60 increase as the mass ratios change from 98% C70 to 98% C60.