Figures & data
Table 1. Measles incidence (x 1,000,000) in Italy, by Regions
Table 2. Rubella incidence (x 1,000,000) in Italy, by Regions
Table 3. Percentage of vaccinated children against measles in Italy in 2016 and comparison with the following calendar years after the introduction of the Decree Law 119/2017
Figure 1. Joinpoint analysis of the trend in vaccination rates for measles and rubella between 2013 and 2019 in Italy. a, trend in vaccination coverage for first dose of measles vaccine; b, trend in vaccination coverage for second dose of measles vaccine; c, trend in vaccination coverage for first dose of rubella vaccine; d, trend in vaccination coverage for second dose of rubella vaccine. The use of asterisks (*) indicates that the Slope is significantly different from zero at the alpha = 0.05 level. Final Selected Model: 1 Joinpoint.
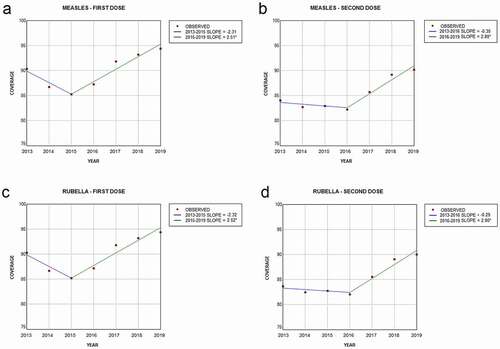
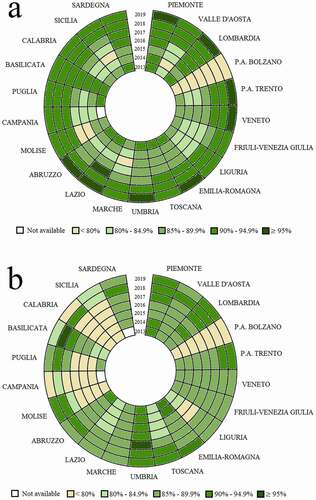
Figure 2. Trends in coverage for first (a) and second (b) dose of measles vaccine (2013–2019) by Region. Each concentric circle represents one year, starting with 2013 in the center.
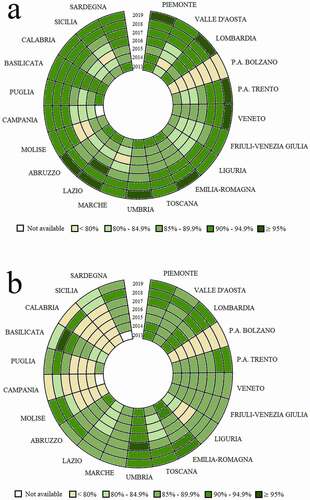
Table 4. Percentage of vaccinated children against rubella in Italy in 2016 and comparison with the following calendar years after the introduction of the Decree Law 119/2017
Figure 3. Trends in vaccination coverage for first (a) and second (b) dose of rubella vaccine (2013–2019) by Region. Each concentric circle represents one year, starting with 2013 in the center.