
Figures & data
Table 1. Age distribution of children hospitalized for rotavirus or non-rotavirus acute gastroenteritis
Table 2. Population-based figures of hospitalizations for rotavirus acute gastroenteritis less than 5 years
Figure 1. Distribution of rotavirus acute gastroenteritis cases by month of admission in patients under 5 years of age (2006/2007–2017/2018 seasons). The pre-rotavirus vaccination years are indicated by small circles, and the self-financed rotavirus vaccination years are indicated by squares.
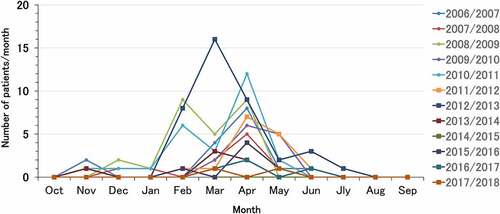
Figure 2. Forecast of hospitalization incidence rate for rotavirus acute gastroenteritis in patients under 5 years of age by time-series analysis. R1, monovalent vaccine; R5, pentavalent vaccine. Blue line shows observed incidence rates, and red line shows forecasted incidence rates obtained by the Holt-Winters additive seasonal smoothing method.
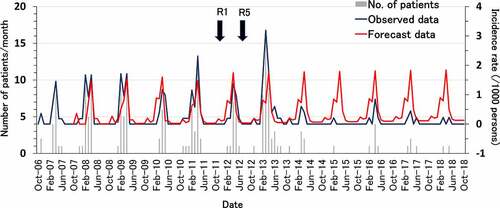
Table 3. Rotavirus vaccine effectiveness estimates against rotavirus acute gastroenteritis hospitalization in post-vaccine period