
Figures & data
Table 1. Summary distribution of characteristics of migrants in China, N = 10013
Figure 1. Vaccination rates of migrants by birth year and vaccination policies.
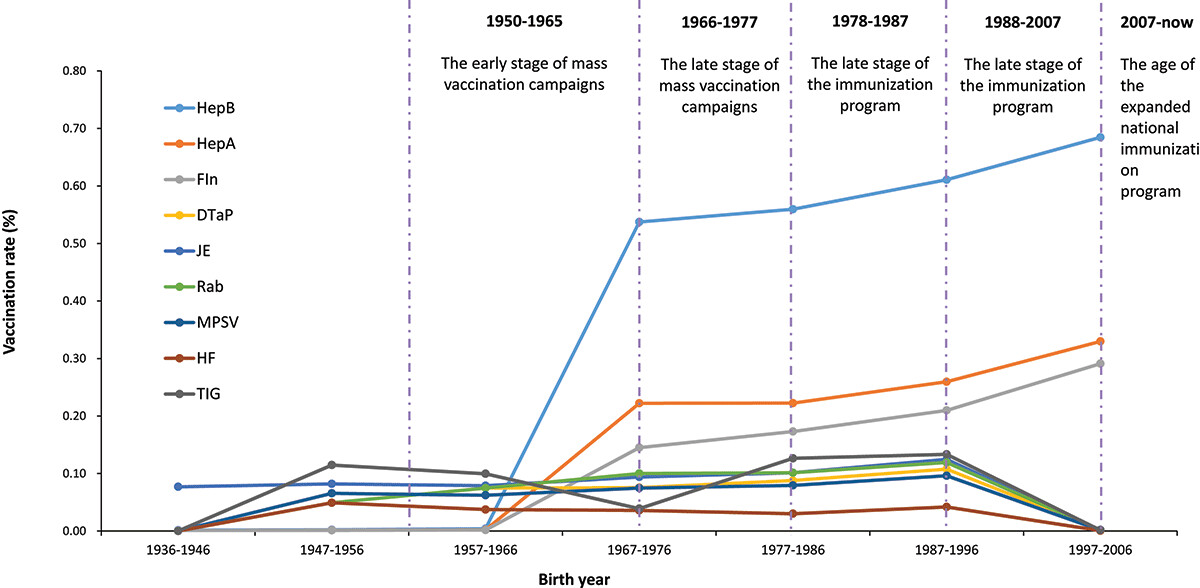
Table 2. Numbers and proportion of different vaccination types of migrants, N = 10013
Table 3. Determinants of vaccination using logistic regression, N = 10013
Table 4. Sensitivity analysis on determinants of vaccination using logistic regression, N = 10013(Model 2)
Supplemental material
Supplemental Material
Download ()Data availability statement
Data are available from the corresponding author by request https://www.ncmi.cn/phda/dataDetails.do?id=CSTR:A0006.11.A000T.201906.000225.