Figures & data
Table 1. Data summary of exome and RNA sequencing. Tables summarizing the (A) whole exome and (B) RNA sequencing data from the patient’s leukemia cells (Initial tumor) and normal PBMCs (Final normal)
Table 2. Read alignment summary for exomes and RNA sequencing. Tables summarizing alignment data from exome sequencing (A) and RNA sequencing (B) of patient’s leukemia cell (Initial tumor) and normal PBMCs (Final normal)
Table 3. Summary of the target region for exome sequencing. Table summarizing coverage, depth of sequencing and on-target reads from patient’s leukemia cells (Initial tumor) and normal PBMCs (Final normal). A targeted mean coverage of 117x for normal and 251x for tumor with 95.43% and 98.27%% bases covered at ≥10x for normal and tumor respectively
Table 4. Summary of passed and on-target somatic variants. Table summarizing the variants from selected reads that were reported from the whole exome sequencing of the patient’s leukemia cells (initial tumor). The on-target is calculated based on the coordinate of the target regions provided by the vendor. SNP = Single nucleotide polymorphism; Ts/Tv = Transitions/Transversions
Table 5. Top prioritized epitopes from the tumor sample. Table enlisting mutant peptides representing the top prioritized epitopes predicted from missense mutations reported in the patient’s leukemia cells
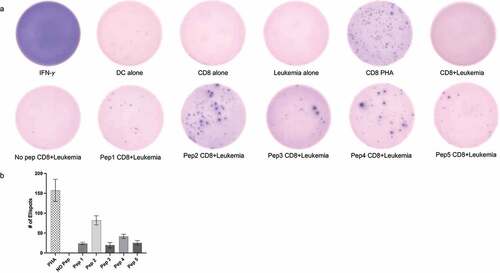
Figure 1. Neoantigen peptides can induce tumor specific CD8+ T cell mediated response in vitro. (a) IFN-γ ELISPOT results showing CD8+ T cell activation when co-cultured with patient leukemia cells. All five peptides representing neoantigens (Pep1-5) showed higher number of IFN-γ spots as compared to cells alone or no peptide controls. CD8+ T cells treated with 0.5 μg/ml phytohemagglutinin (PHA) for 24 hrs were used as a positive control. Representative images from three separate experiments are displayed (b) Quantitation of ELISPOTS from three separate individual manual counts displaying the number of spots in different conditions.