Figures & data
Figure 1. Illustration of COVID-19 determinants in the framework of MCDM.Citation21–28
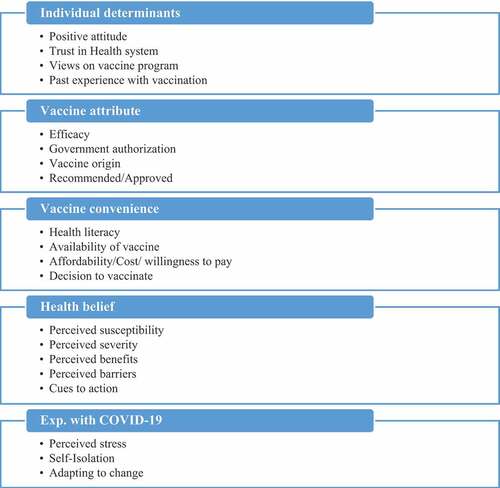
Table 1. Survey detail
Table 2. Pairwise comparison scale
Table 3. Random index.Citation52
Table 4. Sociodemographic characteristics of survey
Table 5. COVID-19 vaccination decision criteria and CR
Table 6. COVID-19 vaccination determinants (%)
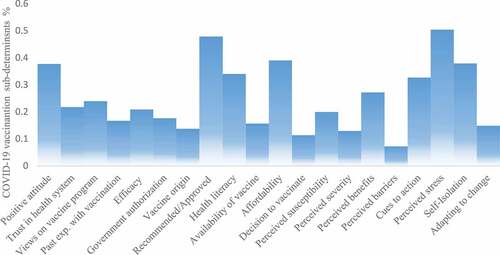
Figure 2. The influential sub-determinants of the COVID-19 vaccine.