
Figures & data
Figure 1. Root weight assessment in P. × xiaohei plants. Changes in root fresh weight among different treatment groups (a) and changes in dry root weight among different treatment groups (b). WT: OL: Numbers on bars represent the percentage increase in weight, n = 3.
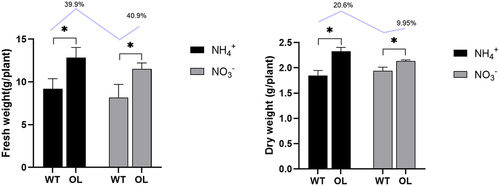
Figure 2. Chemical properties of rhizosphere soil of P. × xiaohei wild-type (WT) and the pxAlaat3 overexpressing line (OL) supplemented with nitrate nitrogen or ammonium nitrogen. (a) Available phosphorus (AP), (b) Total phosphorus (TP), (c) Available potassium (AK), (d) Total potassium (TK), (e) Available nitrogen (AN), (f) Total nitrogen (TN), (g) Soil organic carbon (SOC), (h) C:N, (i) PH.
Figure 3. Changes in enzymatic activity in rhizosphere soil of P. × xiaohei wild-type (WT) and the pxAlaat3 overexpressing line (OL) supplemented with nitrate nitrogen or ammonium nitrogen. (a) catalase, (B) acid phosphatase, (C) soil urease, (D) sucrase, (E) neutral protease, (F) amylase, (G) neutral phosphatase, (H) dehydrogenase, (I) nitrate reductase.
Figure 4. α-diversity index on OUT level measurement of P. × xiaohei wild-type (WT) and the pxAlaat3 overexpressing line (OL) supplemented with nitrate nitrogen or ammonium nitrogen. (a) Chao index, (b) Coverage index, (c) Shannon index, (d) Simpson index.
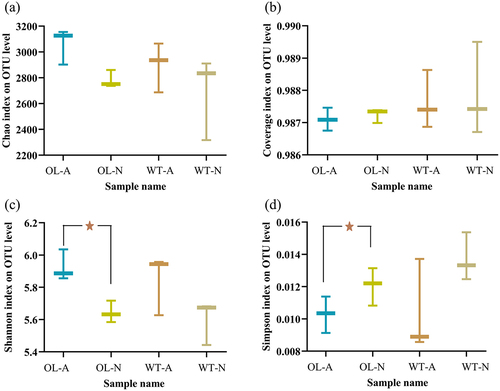
Figure 5. Number of operational taxonomic units (OTUs) and comparison between experimental groups. (a) Number of OTUs; (B) Sample level clustering results; (C) NMDS scatter plot; (D) orthogonal partial least squares discriminant analysis (OPLS-DA) results.
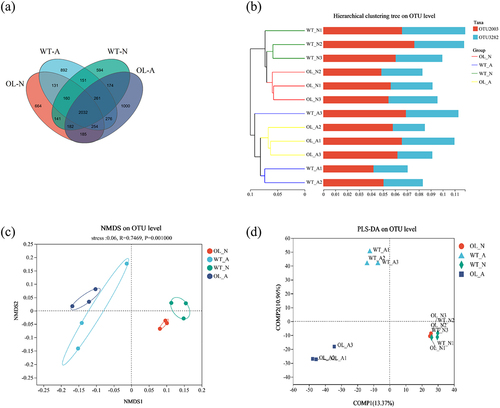
Figure 6. Community composition and inter-group species differences. Results of the proportion of dominant bacterial communities at the phylum (A) and genus (B) levels. Genus level Wilcoxon Rank-Sum Test analysis results under ammonium (C) or nitrate (D) treatment.
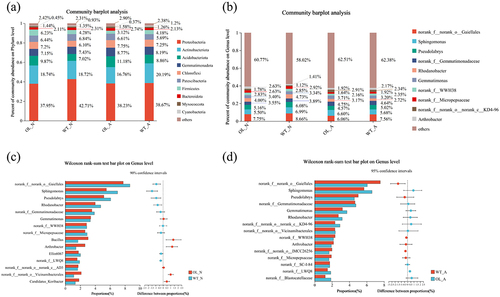
Figure 7. Results of the LefSe analysis. The cladogram shows the microbial species present in significantly different numbers in the WT-N (wild type with nitrate nitrogen) vs. OL-N (pxAlaat3 overexpressing line with nitrate nitrogen) group (a) and the WT-A (wild type and ammonium) vs. OL-A group (pxAlaat3 overexpressing lines with ammonium) (b), (c) WT-N vs. OL-N LDA scores (d) WT-A vs. OL-A LDA scores.
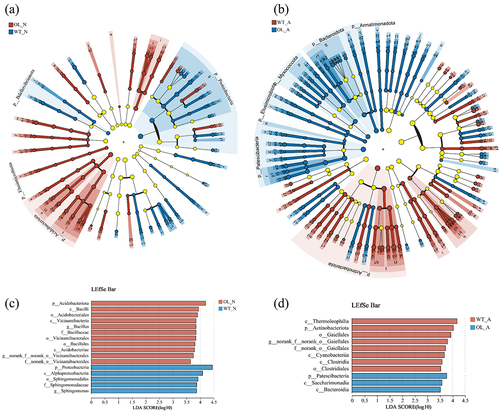
Figure 8. Changes in rhizosphere soil metabolites between the pxAlaat3 overexpressing line (OL) and wild-type (WT) plants. (a) OPLS-DA results; (b) Number of differential metabolites; Heat map of metabolite changes in ammonium treatment (c) and nitrate treatment (d); (e) Display of differential metabolites in pathways. Red background: significant differences under ammonium treatment; Blue background: significant differences under nitrate treatment. Yellow background: significant differences under ammonium and nitrate treatments.
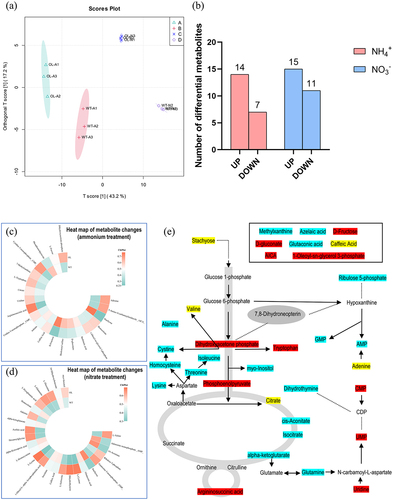
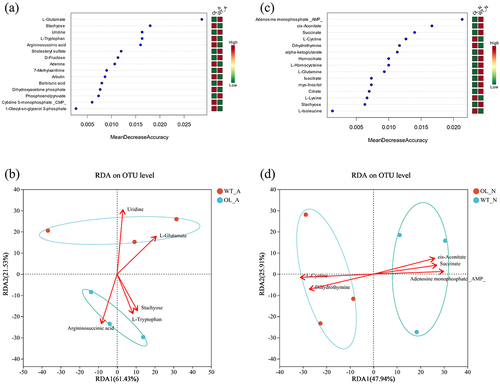
Figure 9. Joint analysis of microorganisms and metabolites. Random forest analysis (a) and RDA analysis (b) under ammonium treatment; random forest Analysis (c) and RDA analysis (d) under nitrate treatment.
Supplemental Material
Download Zip (13.1 MB)Data availability statement
The raw sequence data reported in this paper have been deposited in the Genome Sequence Archive (Genomics, Proteomics & Bioinformatics 2021) in National Genomics Data Center (Nucleic Acids Res 2022), China National Center for Bioinformation/Beijing Institute of Genomics, Chinese Academy of Sciences (GSA: CRA013799) that are publicly accessible at https://ngdc.cncb.ac.cn/gsa.