1,514
Views
5
CrossRef citations to date
0
Altmetric
Methods Article

Intravital multiphoton imaging of mouse tibialis anterior muscle

, , , , , & show all
Article: e1156272 | Received 10 Dec 2015, Accepted 15 Feb 2016, Published online: 08 Apr 2016

Figures & data

Figure 1. Setup for jugular vein catheterization procedure. (A) Mouse limbs and head are securely taped down to the board. (B) Small window of skin is removed at the neck region to expose the jugular vein. (C) The vein is clearly exposed (arrow) after the surrounding muscle and fat tissues are teased away. (D) Two sutures are passed underneath the jugular vein. A knot is tied with the bottom suture at the caudal end (labeled ‘cau’) to stop the blood flow. A loose knot is tied with the top suture at the rostral end (labeled ‘ros’), which will be tightened at the end of the procedure. (E) The 30G needle tip (arrow) is used to guide the insertion of the catheter (arrowhead) into the jugular vein. (F) The catheter is properly inserted into the vein and the needle tip is removed. (G) Close up of the catheter inserted into the vein. Arrow indicates the location where the catheter is inserted into the jugular vein. (H) The catheter is firmly secured with knots using both sutures. Backflow of blood in the catheter after drawing back the syringe indicates that the catheter is well inserted.
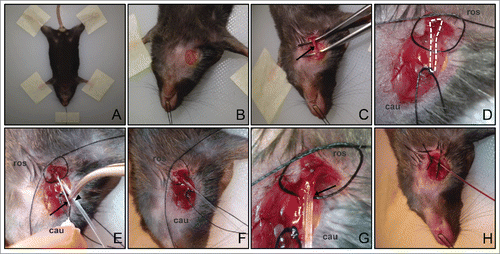
Figure 1. Setup for jugular vein catheterization procedure. (A) Mouse limbs and head are securely taped down to the board. (B) Small window of skin is removed at the neck region to expose the jugular vein. (C) The vein is clearly exposed (arrow) after the surrounding muscle and fat tissues are teased away. (D) Two sutures are passed underneath the jugular vein. A knot is tied with the bottom suture at the caudal end (labeled ‘cau’) to stop the blood flow. A loose knot is tied with the top suture at the rostral end (labeled ‘ros’), which will be tightened at the end of the procedure. (E) The 30G needle tip (arrow) is used to guide the insertion of the catheter (arrowhead) into the jugular vein. (F) The catheter is properly inserted into the vein and the needle tip is removed. (G) Close up of the catheter inserted into the vein. Arrow indicates the location where the catheter is inserted into the jugular vein. (H) The catheter is firmly secured with knots using both sutures. Backflow of blood in the catheter after drawing back the syringe indicates that the catheter is well inserted.

Figure 2. Tibialis anterior skeletal muscle preparation for multiphoton intravital imaging. (A) Materials prepared: a block of blu-tack with the limb indents (dotted lines), 2 strips of blu-tack for securing the limb, and a 10 ml syringe filled with vacuum grease. (B) Right tibia and thigh are cleanly shaved with a razor. Arrow and dotted line indicate the lateral saphenous vein that runs from the ankle to the tibialis posterior muscle. (C) A small window in the skin is made to reveal the muscle tissue. Notice that the right side of the tissue from the major connective tissue (visible as a vertical white line; arrow) has a lower density of blood vessels compared to the left side. (D) Mouse leg is secured with the 2 strips of blu-tack, one placed perpendicular to the other, over the ankle. Forceps were used to press down the blu-tack strips to the block. (E) View of whole animal with the right leg placed in the mold for imaging, and the left leg taped on the heating pad. (F) A small window (dotted line) is made in the outer connective tissue to reveal the skeletal muscle tissue for imaging. The window is made to the right of the major connective tissue (visible as a vertical white line; arrow). (G) A ring of vacuum grease is drawn around the imaging area (arrow). (H) The ring of vacuum grease is filled with a drop of PBS and a coverslip mounted on the coverslip holder is lowered over the tissue. The curved holder for the thermistor (top arrowhead) and the heater block (bottom arrowhead) are screwed on to the coverslip holder. (I) Overview of the final setup for the tibialis anterior skeletal muscle imaging.
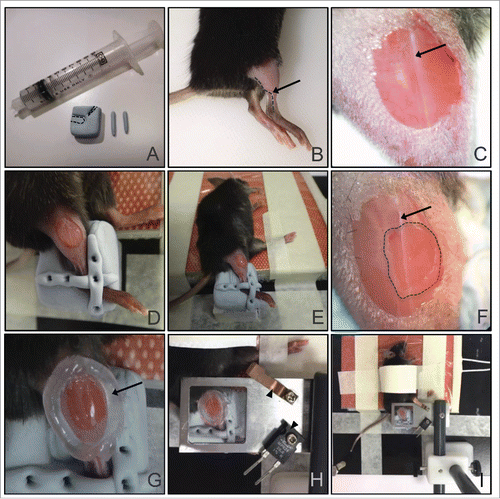
Figure 2. Tibialis anterior skeletal muscle preparation for multiphoton intravital imaging. (A) Materials prepared: a block of blu-tack with the limb indents (dotted lines), 2 strips of blu-tack for securing the limb, and a 10 ml syringe filled with vacuum grease. (B) Right tibia and thigh are cleanly shaved with a razor. Arrow and dotted line indicate the lateral saphenous vein that runs from the ankle to the tibialis posterior muscle. (C) A small window in the skin is made to reveal the muscle tissue. Notice that the right side of the tissue from the major connective tissue (visible as a vertical white line; arrow) has a lower density of blood vessels compared to the left side. (D) Mouse leg is secured with the 2 strips of blu-tack, one placed perpendicular to the other, over the ankle. Forceps were used to press down the blu-tack strips to the block. (E) View of whole animal with the right leg placed in the mold for imaging, and the left leg taped on the heating pad. (F) A small window (dotted line) is made in the outer connective tissue to reveal the skeletal muscle tissue for imaging. The window is made to the right of the major connective tissue (visible as a vertical white line; arrow). (G) A ring of vacuum grease is drawn around the imaging area (arrow). (H) The ring of vacuum grease is filled with a drop of PBS and a coverslip mounted on the coverslip holder is lowered over the tissue. The curved holder for the thermistor (top arrowhead) and the heater block (bottom arrowhead) are screwed on to the coverslip holder. (I) Overview of the final setup for the tibialis anterior skeletal muscle imaging.

Figure 3. Schematic diagram of the setup for the tibialis anterior muscle intravital multiphoton imaging. (A) Schematic diagram of the imaging stage, showing the position of the mouse on the heating pad, with the right tibia in the blu-tack mold. Position of the coverslip holder is outlined in dotted lines. (B) Top view of the coverslip holder. Positions of the thermistor and interface cable, to be connected to the curved holder and heater block, respectively, are shown.
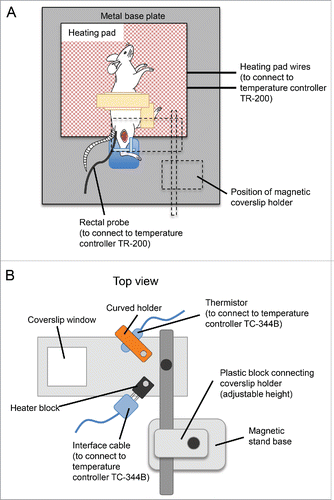
Figure 3. Schematic diagram of the setup for the tibialis anterior muscle intravital multiphoton imaging. (A) Schematic diagram of the imaging stage, showing the position of the mouse on the heating pad, with the right tibia in the blu-tack mold. Position of the coverslip holder is outlined in dotted lines. (B) Top view of the coverslip holder. Positions of the thermistor and interface cable, to be connected to the curved holder and heater block, respectively, are shown.

Figure 4. Visualization of outer connective tissue layers and inner muscle fiber/capillaries. (A) Imaging of the outer connective tissue layers and the inner muscle fiber layer in a LysM-GFP mouse. Muscle macrophages (green) are present in the outer connective tissue layers. SHG shows striations of the connective tissue. Three layers of connective tissues (blue) can be typically captured: Top-most layer has a mesh network, second layer has distinct vertical striations, and third layer has horizontal striations perpendicular to the second layer. Inner muscle fiber has minimal SHG and perivascular macrophages (green) can be seen lining the blood vessels. (B) Imaging of the outer connective tissue layers and the inner muscle fiber layer in a ROSA-mT/mG mouse. Three layers of connective tissues (blue) similar to (A) are shown: Top-most layer has a mesh network, second layer has distinct vertical striations, and third layer has horizontal striations perpendicular to the second layer. Muscle macrophages and blood vessels can be seen (red) in the outer connective tissue layers. Parallel muscle fibers are seen in the inner muscle fiber layer. Striations of the muscle can be seen (zoomed in; inset). Muscle capillaries are present deeper in the muscle fiber layer. Excitation: 950 nm using a Ti:Sapphire laser. Scale bar: 50 μm. Step size: 2–4 μm.
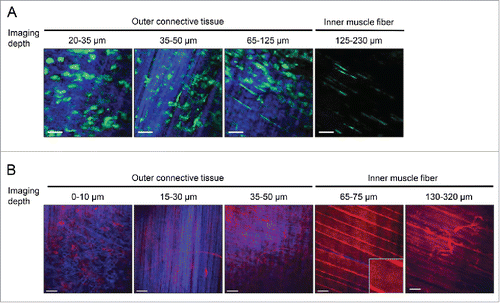
Figure 4. Visualization of outer connective tissue layers and inner muscle fiber/capillaries. (A) Imaging of the outer connective tissue layers and the inner muscle fiber layer in a LysM-GFP mouse. Muscle macrophages (green) are present in the outer connective tissue layers. SHG shows striations of the connective tissue. Three layers of connective tissues (blue) can be typically captured: Top-most layer has a mesh network, second layer has distinct vertical striations, and third layer has horizontal striations perpendicular to the second layer. Inner muscle fiber has minimal SHG and perivascular macrophages (green) can be seen lining the blood vessels. (B) Imaging of the outer connective tissue layers and the inner muscle fiber layer in a ROSA-mT/mG mouse. Three layers of connective tissues (blue) similar to (A) are shown: Top-most layer has a mesh network, second layer has distinct vertical striations, and third layer has horizontal striations perpendicular to the second layer. Muscle macrophages and blood vessels can be seen (red) in the outer connective tissue layers. Parallel muscle fibers are seen in the inner muscle fiber layer. Striations of the muscle can be seen (zoomed in; inset). Muscle capillaries are present deeper in the muscle fiber layer. Excitation: 950 nm using a Ti:Sapphire laser. Scale bar: 50 μm. Step size: 2–4 μm.

Figure 5. Evans Blue intravenous delivery using jugular vein catheter. Snapshot images of the inner muscle fiber layer from in vivo imaging during a slow intravenous delivery of Evans Blue via the jugular vein catheter into a LysM-GFP mouse. Evans Blue is slowly delivered to the mouse at time t=10 min. Snapshot images are shown at 1 min, 5 min, 10 min and 15 min after the start of Evans Blue introduction. Perivascular macrophages (green) line the blood vessels (red). Excitation: 950 nm using a Ti:Sapphire laser. Scale bar: 50 μm.

Figure 5. Evans Blue intravenous delivery using jugular vein catheter. Snapshot images of the inner muscle fiber layer from in vivo imaging during a slow intravenous delivery of Evans Blue via the jugular vein catheter into a LysM-GFP mouse. Evans Blue is slowly delivered to the mouse at time t=10 min. Snapshot images are shown at 1 min, 5 min, 10 min and 15 min after the start of Evans Blue introduction. Perivascular macrophages (green) line the blood vessels (red). Excitation: 950 nm using a Ti:Sapphire laser. Scale bar: 50 μm.

Figure 6. In vivo imaging of inflammatory agent on muscle tissue. Snapshot images of the inner muscle fiber layer from in vivo imaging after topical application of LPS (10 μg) on the tibialis anterior skeletal muscle of a LysM-GFP mouse. GFP-high myeloid cells (mostly neutrophils) extravasate from the blood vessels (red; labeled via i.v. injection of Evans Blue). Excitation: 950 nm using a Ti:Sapphire laser. Scale bar: 50 μm.

Figure 6. In vivo imaging of inflammatory agent on muscle tissue. Snapshot images of the inner muscle fiber layer from in vivo imaging after topical application of LPS (10 μg) on the tibialis anterior skeletal muscle of a LysM-GFP mouse. GFP-high myeloid cells (mostly neutrophils) extravasate from the blood vessels (red; labeled via i.v. injection of Evans Blue). Excitation: 950 nm using a Ti:Sapphire laser. Scale bar: 50 μm.

Table 1. Comparison of cremaster muscle and tibialis muscle for intravital imaging.

Supplemental material

Supplemental_Video_2.mov

Download QuickTime Video (19.9 MB)

Supplemental_Video_1.mov

Download QuickTime Video (2.8 MB)

1156272_Supplemental_Material.zip

Download Zip (2 MB)