2,116
Views
22
CrossRef citations to date
0
Altmetric
Research Paper

Direct visualization of the phenotype of hypoxic tumor cells at single cell resolution in vivo using a new hypoxia probe

, , , , , & show all
Article: e1187803 | Received 22 Dec 2015, Accepted 05 May 2016, Published online: 16 May 2016

Figures & data

Figure 1. MDA-MB-231 and MET1 cell lines are suitable to use with the hypoxia reporter. (A) Western blot with anti-HIF1α and anti-β-tubulin for MTLn3, MDA-MB-231, MCF7 and MET1 breast tumor cells in normoxia, 0.2 mM CoCl2 and 1% O2 culturing conditions. Cells were cultured at test conditions for 20 hours before being lysed. (B) Schematic representation of 5HRE-ODD-mCherry hypoxia reporter plasmid construct. (C) Representative FACS sorting plots for mCherry positive hypoxic MET1-5HREODD mCherry cells at the 3rd cycle of FACS sorting. Left panel shows cells under normoxic culturing conditions as a gating control. Right panel shows cells cultured under 1% O2, 5% CO2, and 94% N2 for approximately 20 hours. The top 10% mCherry positive cells from the 1% O2 cultured cells were collected.
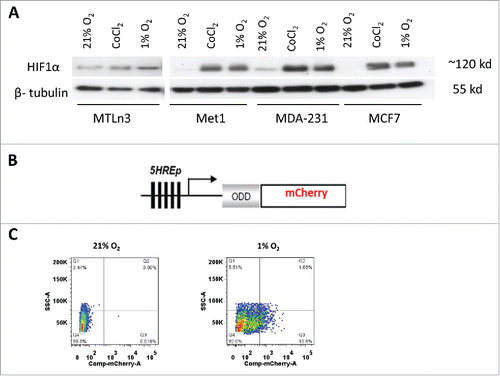
Figure 1. MDA-MB-231 and MET1 cell lines are suitable to use with the hypoxia reporter. (A) Western blot with anti-HIF1α and anti-β-tubulin for MTLn3, MDA-MB-231, MCF7 and MET1 breast tumor cells in normoxia, 0.2 mM CoCl2 and 1% O2 culturing conditions. Cells were cultured at test conditions for 20 hours before being lysed. (B) Schematic representation of 5HRE-ODD-mCherry hypoxia reporter plasmid construct. (C) Representative FACS sorting plots for mCherry positive hypoxic MET1-5HREODD mCherry cells at the 3rd cycle of FACS sorting. Left panel shows cells under normoxic culturing conditions as a gating control. Right panel shows cells cultured under 1% O2, 5% CO2, and 94% N2 for approximately 20 hours. The top 10% mCherry positive cells from the 1% O2 cultured cells were collected.

Figure 2. Hypoxia reporter characterization in vitro. (A) Representative images of GFP MET1-5HRE-ODD-mCherry cells in vitro in normoxia and hypoxia induced by 1% O2, 0.2 mM CoCl2 and 90 µM DFOM for 20 hours respectively. (B) Quantification of percent of cells expressing mCherry in normoxia, or after 20 hours of hypoxia induction with 1% O2, 5% CO2 and 94% N2 in a gas chamber or with 0.2 mM CoCl2 or with 90 µM DFOM. Error bars: mean ± s.e.m. (C) mCherry expression kinetics of MET1 and MDA-MB-231 hypoxia reporter cells upon 1% O2 induction. Error bars: mean ± s.e.m. (D) mCherry expression in MET1 and (E) MDA-MB-231 hypoxia reporter cells. Images analyzed were taken at the times shown after the cells were returned to normoxia after hypoxia treatment of 1%O2 or 0.2 mM CoCl2. error bars: mean ± s.e.m.
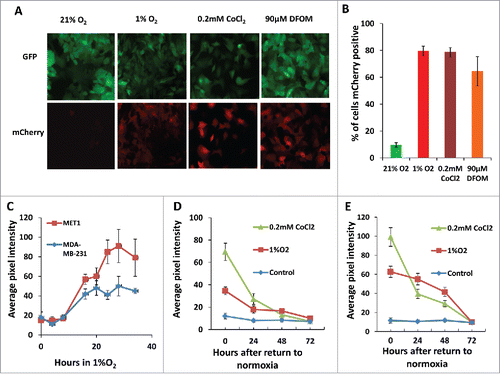
Figure 2. Hypoxia reporter characterization in vitro. (A) Representative images of GFP MET1-5HRE-ODD-mCherry cells in vitro in normoxia and hypoxia induced by 1% O2, 0.2 mM CoCl2 and 90 µM DFOM for 20 hours respectively. (B) Quantification of percent of cells expressing mCherry in normoxia, or after 20 hours of hypoxia induction with 1% O2, 5% CO2 and 94% N2 in a gas chamber or with 0.2 mM CoCl2 or with 90 µM DFOM. Error bars: mean ± s.e.m. (C) mCherry expression kinetics of MET1 and MDA-MB-231 hypoxia reporter cells upon 1% O2 induction. Error bars: mean ± s.e.m. (D) mCherry expression in MET1 and (E) MDA-MB-231 hypoxia reporter cells. Images analyzed were taken at the times shown after the cells were returned to normoxia after hypoxia treatment of 1%O2 or 0.2 mM CoCl2. error bars: mean ± s.e.m.

Figure 3. Hypoxia reporter signal co-localizes with hypoxia response markers in mammary tumors. (A) Representative image of GFP MDA-MB-231-5HREODD-mCherry derived tumor frozen tumor sections within normoxic and hypoxic regions relative to the necrotic area (*) (left panel) and the quantification of normalized GFP or mCherry signal in the yellow box (right panel). Green=GFP, normoxia, red=mCherry, hypoxia. (B) Representative image showing mCherry overexpressing cells colocalizing with pimonidazole adduct staining in MDA-MB-231-5HREODD-mCherry derived tumor frozen sections (left panel), and the quantification of average pimonidazole or mCherry signal in the yellow box. Green=pimonidazole, red=mCherry, blue=nuclei. (C) Representative image showing mCherry overexpressing cells correlated with GLUT1 antibody or pimonidazole adduct antibody staining in MDA-MB-231-5HREODD-mCherry derived tumor frozen sections (left panel), and the quantification of average mCherry or GLUT1 or pimonidazole signal in the yellow box (right panel). Green=pimonidazole, red=mCherry, gray=GLUT1, blue=nuclei. (D) Representative image showing mCherry overexpressing hypoxic cells or pimonidazole adduct positive cells adjacent to high HIF1α expressing cells in MDA-MB-231-5HREODD-mCherry derived tumor frozen sections (left panel), and the quantification of average mCherry or pimonidazole or HIF1α signal in the yellow box (right panel). Green=pimonidazole, red=mCherry, gray= HIF1α, blue=nuclei.
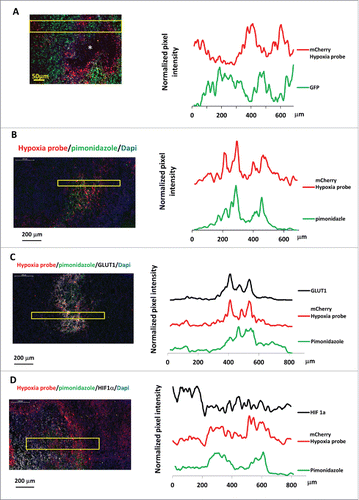
Figure 3. Hypoxia reporter signal co-localizes with hypoxia response markers in mammary tumors. (A) Representative image of GFP MDA-MB-231-5HREODD-mCherry derived tumor frozen tumor sections within normoxic and hypoxic regions relative to the necrotic area (*) (left panel) and the quantification of normalized GFP or mCherry signal in the yellow box (right panel). Green=GFP, normoxia, red=mCherry, hypoxia. (B) Representative image showing mCherry overexpressing cells colocalizing with pimonidazole adduct staining in MDA-MB-231-5HREODD-mCherry derived tumor frozen sections (left panel), and the quantification of average pimonidazole or mCherry signal in the yellow box. Green=pimonidazole, red=mCherry, blue=nuclei. (C) Representative image showing mCherry overexpressing cells correlated with GLUT1 antibody or pimonidazole adduct antibody staining in MDA-MB-231-5HREODD-mCherry derived tumor frozen sections (left panel), and the quantification of average mCherry or GLUT1 or pimonidazole signal in the yellow box (right panel). Green=pimonidazole, red=mCherry, gray=GLUT1, blue=nuclei. (D) Representative image showing mCherry overexpressing hypoxic cells or pimonidazole adduct positive cells adjacent to high HIF1α expressing cells in MDA-MB-231-5HREODD-mCherry derived tumor frozen sections (left panel), and the quantification of average mCherry or pimonidazole or HIF1α signal in the yellow box (right panel). Green=pimonidazole, red=mCherry, gray= HIF1α, blue=nuclei.

Figure 4. Hypoxic tumor cell distribution relative to blood vessels. (A) Representative images of CD31 antibody staining for blood vessel endothelium in GFP-MDA-MB-231-5HREODD-mCherry tumor frozen sections showing the hypoxic cells are found both away from and adjacent to blood vessels. Green=GFP hypoxia reporter in normoxia; Red=mCherry hypoxia reporter in hypoxia, Gray=CD31. (B and C) Representative images of tumor frozen sections (B) and ex vivo imaging (C) to show perfused blood vessels (green) relative to hypoxic cell distribution (red) in MDA-MB-231-5HREODD-mCherry derived tumors that were IV injected with lectin (green) before sacrificing. In areas of flowing blood vessels the hypoxic tumor cells are closely associated with a subset of blood vessels. Yellow boxes indicate regions shown at high magnification. In this tumor, tumor cell does not express the GFP volume marker so as to prevent overlap with FITC lectin signal. For B and C, Green =FITC lectin stained blood vessels, red = mCherry hypoxia, Gray=DAPI.
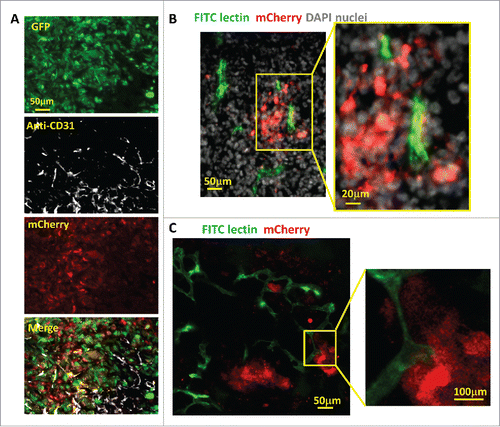
Figure 4. Hypoxic tumor cell distribution relative to blood vessels. (A) Representative images of CD31 antibody staining for blood vessel endothelium in GFP-MDA-MB-231-5HREODD-mCherry tumor frozen sections showing the hypoxic cells are found both away from and adjacent to blood vessels. Green=GFP hypoxia reporter in normoxia; Red=mCherry hypoxia reporter in hypoxia, Gray=CD31. (B and C) Representative images of tumor frozen sections (B) and ex vivo imaging (C) to show perfused blood vessels (green) relative to hypoxic cell distribution (red) in MDA-MB-231-5HREODD-mCherry derived tumors that were IV injected with lectin (green) before sacrificing. In areas of flowing blood vessels the hypoxic tumor cells are closely associated with a subset of blood vessels. Yellow boxes indicate regions shown at high magnification. In this tumor, tumor cell does not express the GFP volume marker so as to prevent overlap with FITC lectin signal. For B and C, Green =FITC lectin stained blood vessels, red = mCherry hypoxia, Gray=DAPI.

Figure 5. Hypoxic tumor cells are enriched in the invasive and chemotactic tumor cell population in vivo. (A) Multiphoton microscopy images of GFP-MDA-MB-231-5HREODD-mCherry xenograft tumor cells at 0, 11 and 28 minutes. White arrows point to GFP-only normoxic cells. Red arrow points to a motile mCherry positive hypoxic cell. Each moving cell outline was traced. The green outlined cells are normoxic cells and the red outlined cell is a hypoxic cell. Green=GFP normoxic, Red=mCherry hypoxic, Blue=Second Harmonic Generation (SHG) from collagen. (B) Quantification of average cell velocity in vivo migration for hypoxic and normoxic cells. Fields of view containing hypoxic cells were analyzed for motion of either green normoxic and/or red hypoxic cells, n=28. P=0.02 (Student's t-test), error bars: mean±s.e.m. (C) Representative images of collagen ¾antibody staining on GFP MDA-MB-231 hypoxia reporter derived tumor tissue frozen sections showing overlap of collagen degradation with hypoxic tumor cells. The lower panel images are at higher magnification to have a better view of the collagen¾ antibody staining around single cells. Red=mCherry hypoxic, green=GFP normoxic, gray=collagen¾, blue=nuclei. (D) Quantification of the percent of cells with collagen degradation within the normoxic or hypoxic tumor cell populations. Each bar is the percentage of the respective cell type. The green bar is normalized to the number of total green cells while the red bar is normalized to the total number of hypoxic cells. Fields of view containing collagen degradation were analyzed. P value is by Student's t-test, error bars: mean±s.e.m., n=5. (E) Percentage of hypoxic cells in the population that migrated to HuEGF gradient (chemotactic cells) vs the percentage of hypoxic cells in primary tumor tissue where the needle was placed. Representative images are tumor cells in primary tumor tissue and chemotactic tumor cells collected using the in vivo invasion assay with 25 nM huEGF. Red=mCherry hypoxic, green=GFP normoxic. Error bar: SEM. * p<0.05 (Student's t-test), n=3 mice. (F) Analysis of circulating tumor cells. CTCs were imaged for mCherry and GFP signals. mCherry and GFP pixel intensity was normalized to the highest signal in each channel respectively among the CTCs. The ratio of the normalized mCherry to GFP signals in individual cells was calculated. Ratio of normalized mCherry to GFP below 0.5 = normoxia, above 0.5 = hypoxia. The percentage of hypoxic and normoxic cells were plotted. 4 mice were used. The representative images for hypoxic and normoxic cells are shown on the right.
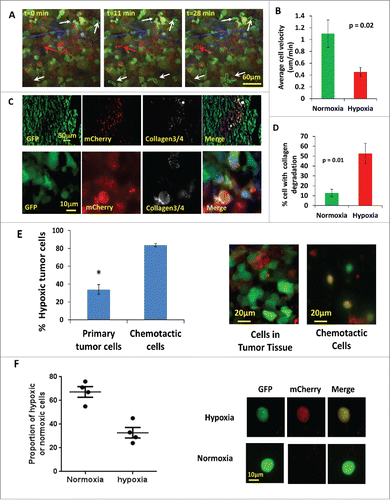
Figure 5. Hypoxic tumor cells are enriched in the invasive and chemotactic tumor cell population in vivo. (A) Multiphoton microscopy images of GFP-MDA-MB-231-5HREODD-mCherry xenograft tumor cells at 0, 11 and 28 minutes. White arrows point to GFP-only normoxic cells. Red arrow points to a motile mCherry positive hypoxic cell. Each moving cell outline was traced. The green outlined cells are normoxic cells and the red outlined cell is a hypoxic cell. Green=GFP normoxic, Red=mCherry hypoxic, Blue=Second Harmonic Generation (SHG) from collagen. (B) Quantification of average cell velocity in vivo migration for hypoxic and normoxic cells. Fields of view containing hypoxic cells were analyzed for motion of either green normoxic and/or red hypoxic cells, n=28. P=0.02 (Student's t-test), error bars: mean±s.e.m. (C) Representative images of collagen ¾antibody staining on GFP MDA-MB-231 hypoxia reporter derived tumor tissue frozen sections showing overlap of collagen degradation with hypoxic tumor cells. The lower panel images are at higher magnification to have a better view of the collagen¾ antibody staining around single cells. Red=mCherry hypoxic, green=GFP normoxic, gray=collagen¾, blue=nuclei. (D) Quantification of the percent of cells with collagen degradation within the normoxic or hypoxic tumor cell populations. Each bar is the percentage of the respective cell type. The green bar is normalized to the number of total green cells while the red bar is normalized to the total number of hypoxic cells. Fields of view containing collagen degradation were analyzed. P value is by Student's t-test, error bars: mean±s.e.m., n=5. (E) Percentage of hypoxic cells in the population that migrated to HuEGF gradient (chemotactic cells) vs the percentage of hypoxic cells in primary tumor tissue where the needle was placed. Representative images are tumor cells in primary tumor tissue and chemotactic tumor cells collected using the in vivo invasion assay with 25 nM huEGF. Red=mCherry hypoxic, green=GFP normoxic. Error bar: SEM. * p<0.05 (Student's t-test), n=3 mice. (F) Analysis of circulating tumor cells. CTCs were imaged for mCherry and GFP signals. mCherry and GFP pixel intensity was normalized to the highest signal in each channel respectively among the CTCs. The ratio of the normalized mCherry to GFP signals in individual cells was calculated. Ratio of normalized mCherry to GFP below 0.5 = normoxia, above 0.5 = hypoxia. The percentage of hypoxic and normoxic cells were plotted. 4 mice were used. The representative images for hypoxic and normoxic cells are shown on the right.
Supplemental material

1187803_Supplemental_Material.zip

Download Zip (19.8 MB)

Reprints and Corporate Permissions

Please note: Selecting permissions does not provide access to the full text of the article, please see our help page How do I view content?

To request a reprint or corporate permissions for this article, please click on the relevant link below:

Academic Permissions

Please note: Selecting permissions does not provide access to the full text of the article, please see our help page How do I view content?

Obtain permissions instantly via Rightslink by clicking on the button below:

If you are unable to obtain permissions via Rightslink, please complete and submit this Permissions form. For more information, please visit our Permissions help page.