Figures & data
Table 1. The measurements used in the quantitative content analysis.
Table 2. Correlations between the different sides of the conflict and various message strategies.
Table 3. Differences between the different sides of the conflict in various message strategies.
Table 4. Differences in users’ engagement to pro-Israeli and pro-Palestinian videos.
Table 5. Regression models predicting users’ engagement.
Figure 1. Interactions effects of both the side of the conflict that had published the content and different message strategies on the number of shares the video generate.
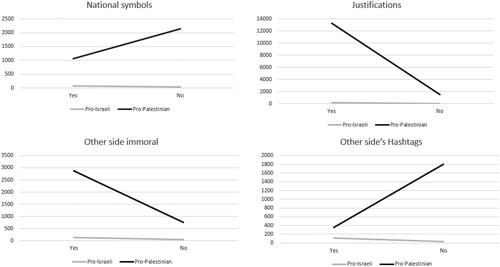
Table 6. The effect of both the side of the conflict that had published the content and different message strategies on the number of shares the video generated (using two ways ANOVA).
Table 7. The effect of both the side of the conflict that had published the content and the message strategies of victimization and blame on the number of shares the video generated (using regression models).
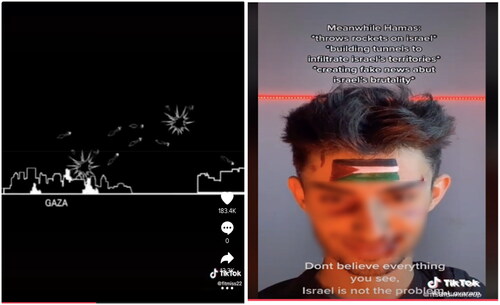
Figure 2. Critical monologue persuading (left) raw footage from the ground demonstrating (right).

Figure 3. Montage in the service of external authenticity.
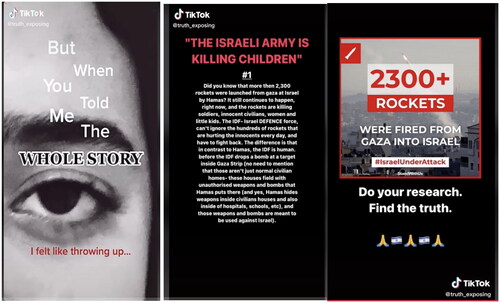
Figure 4. Rally montage communicating affiliation.
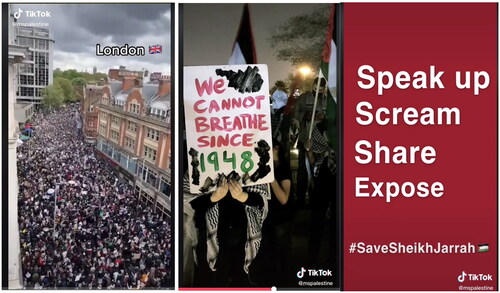
Figure 5. Cartoon and makeup art conveying creativity.