
Figures & data
Table 1 List of ALS mimics.
Table 2 Characteristics of study participants and biomarker concentrations at diagnosis (in ng/L).
Figure 1 Box plots for biomarker concentrations in ALS patients, ALS mimics, and different control groups. Note: Biomarker concentrations are shown on a logarithmic scale in ng/L. Differences are calculated using Mann–Whitney U test. *** p < 0.001. NS: Not statistically significant. INC: Inflammatory neurological controls. NINC: Non-inflammatory neurological controls. HC: Healthy controls. pNfH: phosphorylated neurofilament heavy. NfL: neurofilament light. CHIT1: chitotriosidase-1. MCP-1: monocyte chemoattractant protein-1.
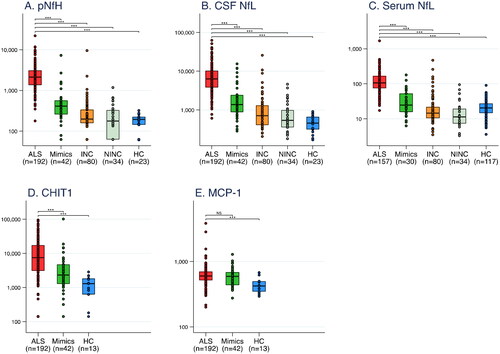
Table 3 Correlation matrix of biomarkers measured in ALS patients at the time of diagnosis.
Table 4 Area under the curve (AUC) for differentiating ALS patients from ALS mimics, adjusted for age at measurement, together with optimal cutoffs (estimated with Youden index) and their sensitivity and specificity.
Figure 2 Predicting longitudinal progression rate and survival among ALS patients. (A-B) Quantile regression models predicting median longitudinal progression rate in relation to biomarker levels (medium and high versus low), in simple (A) and multivariable (B) analyses. (C-D) Cox proportional hazards regression models predicting survival with biomarker levels (medium and high versus low), in simple (C) and multivariable (D) analyses. Note: 192 patients with CSF and 157 patients with serum. In multivariable analyses the following variables were adjusted for: sex, age at diagnosis, BMI at diagnosis, site of onset, El Escorial diagnostic criteria, diagnostic delay, baseline ALSFRS-R, baseline progression rate, and sign of FTD at diagnosis. Biomarker concentrations were divided into tertiles, with low/medium/high concentrations. pNfH: phosphorylated neurofilament heavy. NfL: neurofilament light. CHIT1: chitotriosidase-1. MCP-1: monocyte chemoattractant protein-1.
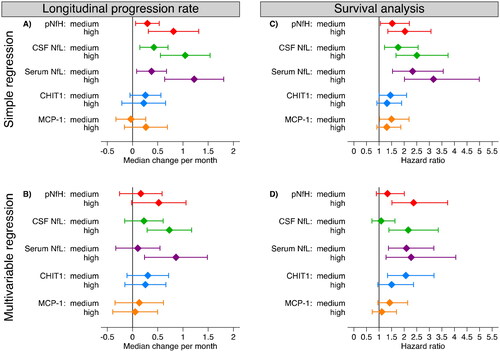
Figure 3 Temporal patterns per biomarker for each ALS patient from date of first sampling and with mean change (assuming a linear model, from the longitudinal analysis in ), for spinal and bulbar onset patients separately (all measured in ng/L). pNfH: phosphorylated neurofilament heavy. NfL: neurofilament light. CHIT1: chitotriosidase-1. MCP-1: monocyte chemoattractant protein-1.
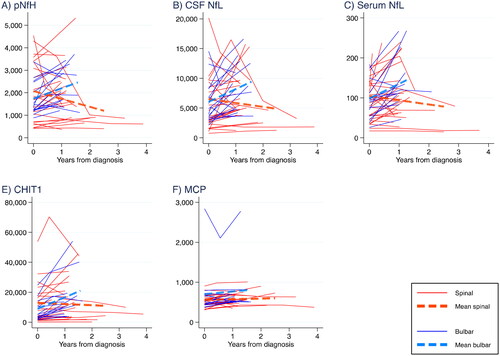
Table 5 Number of samples (a) and temporal changes of biomarker concentrations per year after ALS diagnosis (b), for all patients and for spinal and bulbar onset patients (mean annual change in ng/L per year).
Supplemental Material
Download PDF (1 MB)Data availability statement
Anonymized data will be made available upon reasonable requests to the corresponding author. The data are not publicly available due to privacy or ethical restrictions.