
Figures & data
Table 1. Demographic and clinical characteristics of participants.
Table 2. Summary of negative binomial regression analysis results in healthy participants (n = 93).
Table 3. Summary of negative binomial regression analysis results in ALS patients(n = 98).
Figure 1. ROC curve for BBI-after scores, ALS-FTD-Q, FBI as tested against clinical diagnoses of behavioral impairment in ALS patients. ROC: receiver-operating characteristic; BBI: Beaumont behavioral inventory; ALS-FTD-Q: amyotrophic lateral sclerosis-frontotemporal dementia-questionnaire; FBI: frontal behavioral inventory.
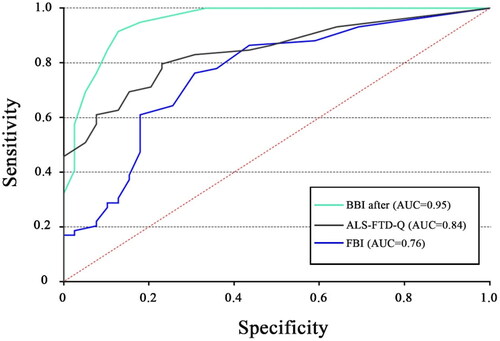
Table 4. Total ALS cohort’s behavioral change on BBI (n = 98).
Data availability statement
The data that support the findings of this study are available from the corresponding author upon reasonable request from any qualified investigator, maintaining anonymization of the patients.