Figures & data
Figure 1 Sample of available data of first-degree relatives of index patients.
Age indicates age at onset for index patient, age at time of questionnaire (censor) for living relatives, or age at death for other relatives.
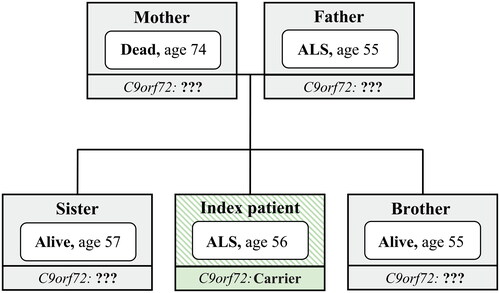
Table 1 Clinical characteristics of index patients.
Table 2 Characteristics of included first-degree relatives.
Figure 2 Age-related risk of ALS in the C9orf72 repeat expansion.
Cumulative incidence curve of ALS in 933 first-degree relatives, adjusted for death from other causes. Censored indicates relative was alive at time of questionnaire. Shaded area represents bootstrapped 95% percentile interval.
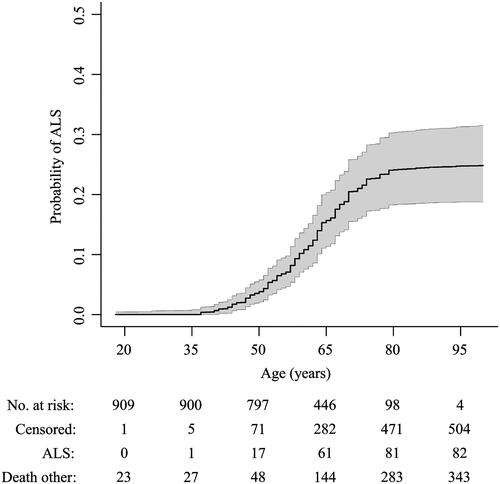
Figure 3 Sensitivity analyses of risk of ALS in the C9orf72 repeat expansion.
Primary analysis included relatives with a known event, imputing missing age, by creating multiple imputed datasets (n = 100) disregarding the first 100 iterations (burn-in), and assuming 50% of relatives are mutation carriers. Complete cases only included relatives with known age and event. Fully imputed included all relatives, imputing both age and event. Data since 2011 indicates questionnaires completed prior to 2011 were excluded. Registry data indicates data collected through the registry, excluding data originating from other sources. 40% carrier and 60% carrier indicate the assumed number of relatives carrying the repeat expansion was changed to 40% and 60%, respectively, reflecting the uncertainty in the Mendelian inheritance probability. Age at onset ≥ 60 year included only index patients with an age at disease onset ≥ 60 years. Family size ≥ 6 only included index patients with a family size ≥ 6.
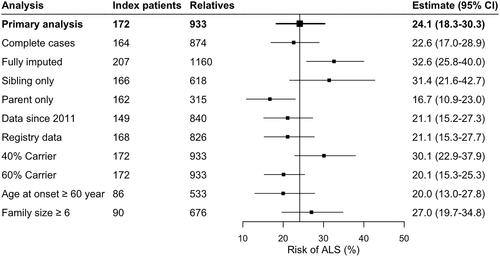
Figure 4 Family-specific risk of developing ALS.
(A) Variability in baseline risk across families. Relative risks were calculated using a mixed effects Cox proportional hazards model with a random intercept term for the baseline hazard. A value of 2.0 indicates that the hazard in that family is twice the hazard of the entire study. (B) Overall, there was no clear correlation between family-specific hazard ratios and family size (Pearson 0.08, p = 0.29). The shaded grey area indicates the expected random variability in baseline hazards for each family size if the baseline hazard would be identical across families, expressed as 95% confidence interval. The majority of the family-specific hazard ratios fall out-side the 95% confidence interval, indicating that the variation in family-specific hazard ratios is larger than expected under random chance.
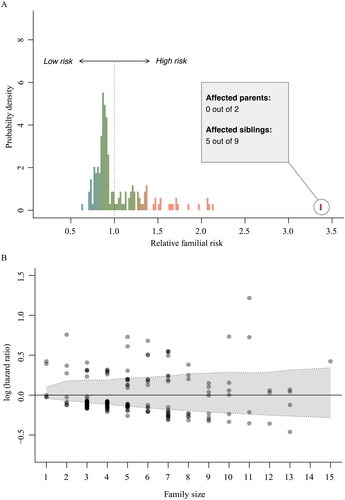
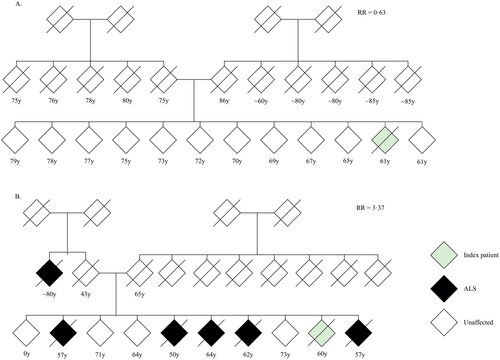
Figure 5 Pedigree charts of two index patients.
(A) Pedigree of index patient classified as sporadic ALS. (B) Pedigree of index patient classified as familial ALS. Given age indicates age at onset for index patient, age at time of family history questionnaire for living relatives and age at death for other relatives. RR = family-specific relative ALS risk; y = years.