
Figures & data
Table 1. Primer sequences and target gene references.
Figure 1. Chemical composition of Prakasine nanoparticles (PRK-NPs). (A–C) Narrow X-ray photoelectron spectra. (D) Survey scan. The spectra reveal the presence of (A) Hg, (B) HgS, (C) S, and (D) Hg compounds.
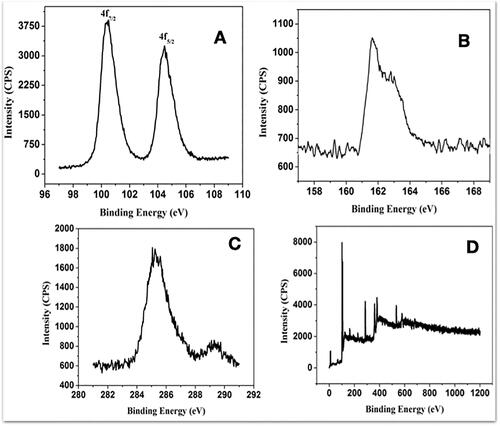
Figure 2. PRK-NP purity and stability. (A) PRK-NP X-ray diffraction (XRD) spectrum pattern. The diffraction peaks are indicative of pure hexagonal phase HgS. (B) Fourier-transform infra-red (FTIR) spectrum indicates that HgS is capped with an organic surface. (B-a) FTIR shows that Hg is bonded to sulphide groups. (B-b) FTIR shows that the HgS product is free of impurities. (C–D) Zeta potential measurement before (C) and after storage (D).
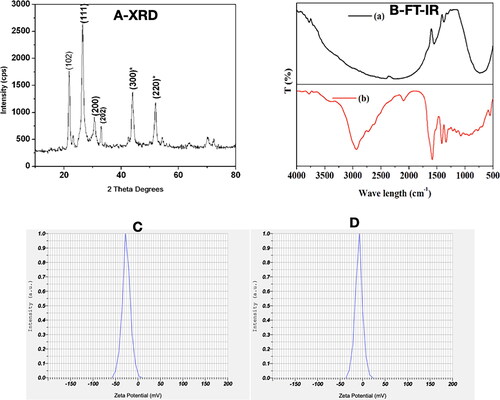
Figure 3. Characterization of PRK-NP morphology by scanning electron microscopy (SEM), energy dispersive spectroscopy (EDAX), and transmission electron microscopy (TEM). (A1–A3) SEM images of products fabricated by solid state synthesis with different reaction times. (A4) The EDAX scan indicates the presence of Hg and S in the product. (B) TEM images at different resolutions reveal an average particle size of 90–100 nm. (C) Size (diameter) distribution of PRK-NPs before storage. (D) Size distribution after storage for 4 weeks. (E) Zeta potential and particle dispersity index (DPI) as metrics of particle stability in storage.
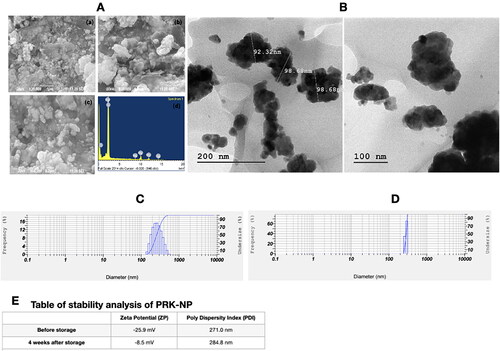
Figure 4. Nontoxicity of PRK-NPs against L6 mouse fibroblasts. (A) Summary of MTT assay results (% viable cells) for the indicated concentrations and exposure times. All treatments were conducted in triplicates. (B–D) Inverted Light microscopy images of the indicated treatment groups.
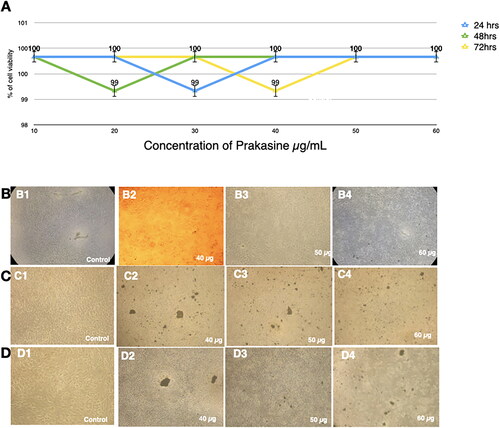
Figure 5. Nontoxicity of PRK-NPs against MCF-7 liver cancer cells in vitro. (A) MTT assay result summary (% viable cells) for the indicated concentrations and exposure times. All treatments were conducted in triplicates. (B–D) Inverted Light microscopy images of the indicated treatment groups.
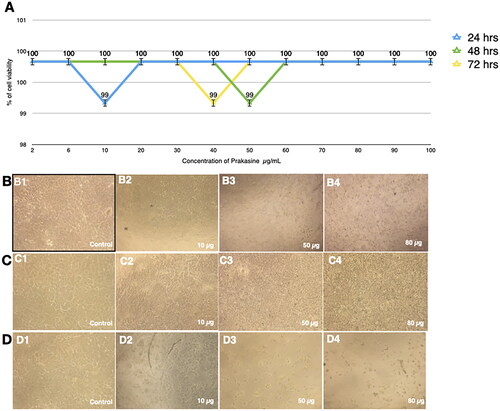
Figure 6. Low apoptosis rate of the HEK293 cells in response to the PRK-NP treatment. The apoptosis rate was assessed by fluorescence activated cell sorting (FACS) analysis of cells double-stained with Annexin V and propidium iodide. (A) Control and (B) PRK-NP-treated cells.
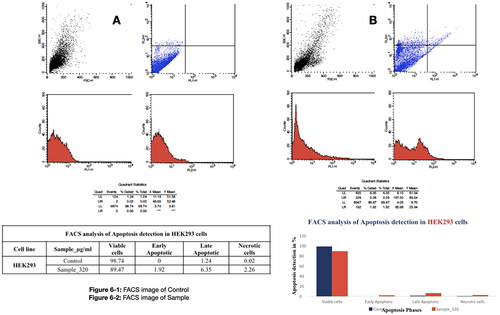
Figure 7. Low acute PRK-NP toxicity in zebrafish. (A) Tissues from untreated control animals: (1) heart (gross morphology), (2) myocardial fibres, (3) brain section, (4) liver (gross morphology), (5) liver histology. (B–D) Tissues from zebrafish receiving the compound at a concentration of (B) 3 µg/g body weight, (C) 30 µg/g body weight, or (D) 90 µg/g body weight.
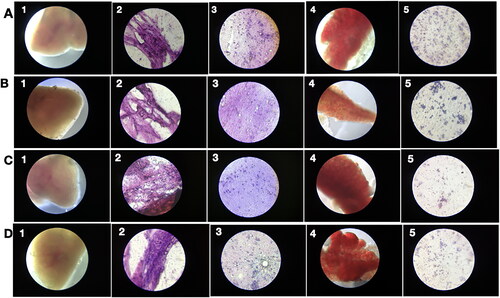
Figure 8. PRK-NP antitumor activity of and its effects on WBC proliferation in zebrafish. (A) Liver tumour elimination by high-dose PRK-NP treatment. The tissue samples were obtained 14 days after the treatment. (1) Control zebrafish not inoculated with liver cancer cells with normal tissues and normal cell spacing (black arrows). (2) Liver tissue at day 14 after inoculation with liver cancer cells without treatment shows a more disorganised tissue structure, abnormal growth, and irregular membrane patterns (red arrows). (3–5) Reduced number of tumour cells and absence of cancer cells at 3 and 90 µg/g PRK-NP, respectively. (B) PRK-NP-mediated suppression of neovascularization in liver tissues. (1) The control tissue from uninoculated zebrafish shows no neovascularization, established blood vessels, or new capillary formation. (2) Well-established neovascularization and capillary networks indicative of fully functional tumour tissue 14 days after inoculation without intervening treatment. (3–5) Thinner neovascularization to the absence of neovascularization at 3, 30 and 90 µg/g of PRK-NP, respectively, 14 days after the inoculation. (C) Visualization of WBC proliferation in response to liver cancer cell inoculation and PRK-NP treatment. The WBC number gradually increased from day 0 to 7 and returned to the baseline by day 14, concomitant with tumour elimination in tumour models treated with 90 µg/g of PRK-NP. (D) The treatment with 90 mg/g of PRK-NP markedly reduced the tumour size (to 6% of that of the inoculated control animals). (E) Difference in the WBC proliferation rate following inoculation and PRK-NP treatment. The graph indicates an increased WBC number of approximately 16 × 106 cells/mL blood on day 7 post-inoculation in the 90 µg/g group, which reduced to approximately 7 × 10⁶ cells by day 14. No significant changes could be observed in the WBC number in the other groups.
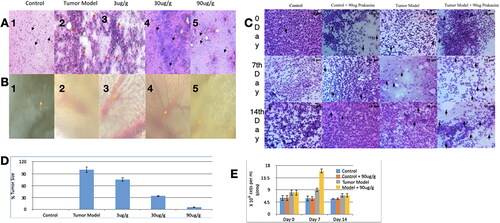
Figure 9. Low chronic PRK-NP toxicity in zebrafish. (A) Tissue samples from untreated zebrafish (samples 1–5 as indicated in ) and animals receiving the compound at a concentration of (B) 3 µg/g body weight. (C) 30 µg/g body weight, or (D) 90 µg/g body weight.
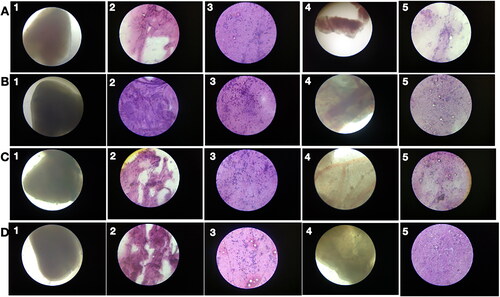
Figure 10. Gene expression profiling of zebrafish liver following tumour cell inoculation and (or) PRK-NP treatment. (A) Gene expression profile on day 7. (B) Gene expression profile on day 14. (The assay values are average values of triplicates.).
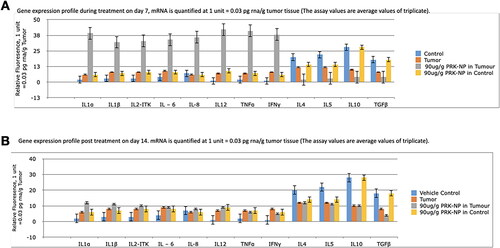
Figure 11. Changes in the immune-related gene expression levels within liver tumour samples following the treatment with 90 µg/g of PRK-NP or unprocessed mercury compound. (A) After 7 days of treatment. (B) After 14 days of treatment. The results are expressed as the average values of triplicate RT-qPCR measurements. In general, PRK-NP increased the expression of proinflammatory factors and suppressed that of anti-inflammatory factors. (The assay values are average values of triplicates.).
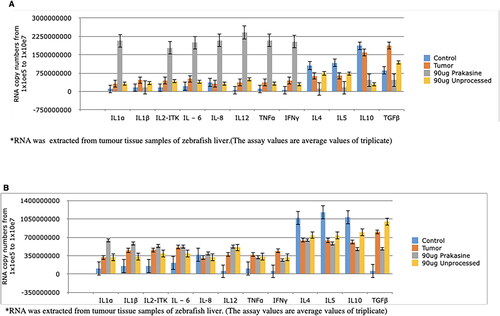
Figure 12. Changes in serum levels of immune-related factors following the treatment with 90 µg/g of PRK-NP or unprocessed mercury compound. (A) After 7 days of treatment. (B) After 14 days of treatment. The results are expressed as the average values of triplicate PCR measurements. The blood samples were obtained from the posterioventral tail and gills. The concentrations were measured by ELISA. The pattern of concentration changes generally reflected the changes in the tumour expression levels. (The assay values are average values of triplicates).
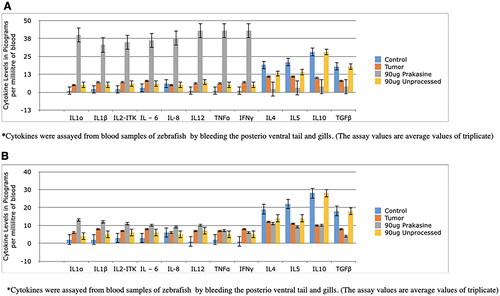
Figure 13. Mortality rates, tumour sizes, and gene expression changes in zebrafish treated with PRK-NP, an unprocessed mercury compound, docetaxel, or paclitaxel. PRK-NP induced the most significant reduction in both tumour volume and mortality.
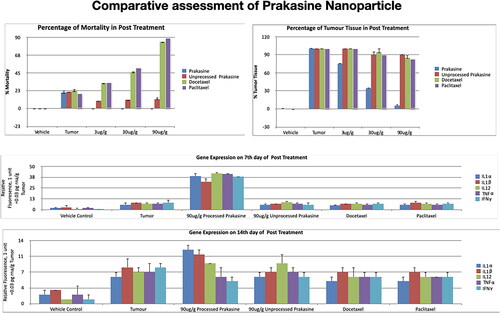
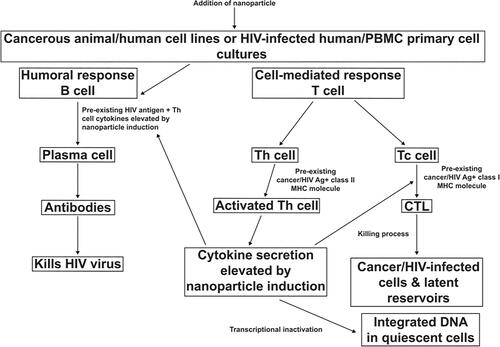
Figure 14. Proposed effector mechanism of PRK-NP against cancer and human immunodeficiency virus.
Data availability statement
The data that support the findings of this study are available from the corresponding author, [Prakash SK], upon reasonable request.