
Figures & data
Table 1. Composition of paroxetine-loaded solid lipid nanoparticles containing different lipid and surfactant concentrations.
Figure 1. Illustration of the SLN patches with different parts and the components.
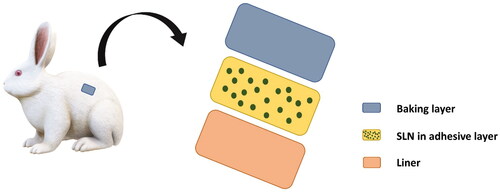
Table 3. Composition of transdermal patch.
Table 2. Particle size, zeta potential, PDI and entrapment efficiency of formulations.
Figure 2. Scanning electron microscope image of paroxetine-loaded SLNs embedded in patch formulation.
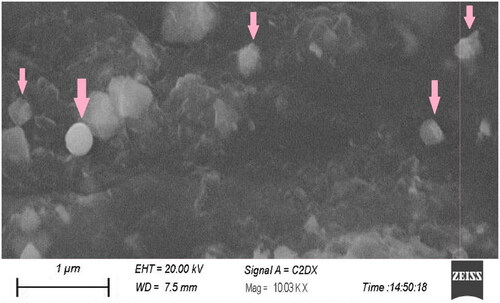
Figure 3. FT-IR of pure drug (a), lipid (b), surfactant (c) and drug loaded SLN formulation (d).
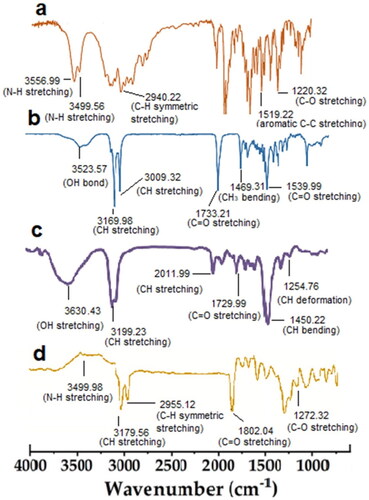
Figure 4. Comparison of in-vitro drug release profile with lipid concentration (a). Comparison of in-vitro drug release profile with surfactant concentration (b). Comparison of in-vitro drug release profile of all formulation with control (c).
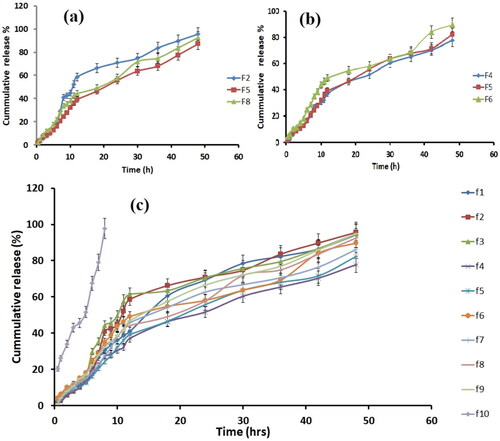
Table 4. Kinetic constants and regression coefficients of kinetic models for drug release from F4.
Figure 5. DSC of pure drug (a), lipid (b) and drug loaded SLN formulation (c).
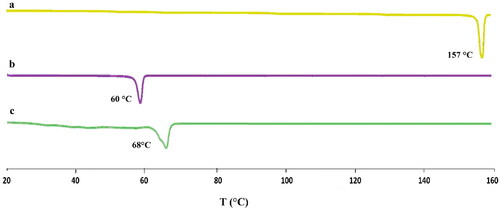
Figure 6. XRD of pure drug (a) and drug loaded SLN formulation (b).
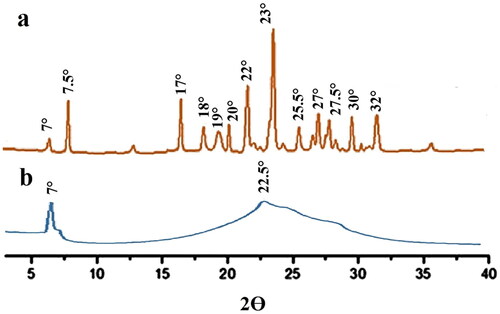
Table 5. Physiochemical properties of transdermal patches.
Figure 7. Comparison of drug permeation of P1 with control (a). Comparison of drug permeation of P2 with control (b). Comparison of drug permeation of P3 with control. (c) Comparison of drug permeation of all formulations with control (d).
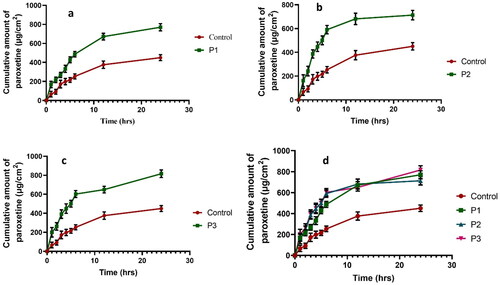
Table 6. Cumulative drug permeation and skin irritation studies..
Table 7. The steady state flux and permeability coefficient.
Table 8. Skin irritation test.
Data availability statement
The data that support the findings of this study are available from the corresponding author, [GM], upon reasonable request.