
Figures & data
Table 1. Basic Information of selected datasets acquired from GEO.
Figure 1. Immune cell infiltration in OA and normal tissues. (A) PCA of 64 immune cell types, and corresponding abundance calculated by xCell algorithm; (B) Heatmap of the 64 immune cell types; (C) Box plot of the 64 immune cell types; (D) Relative percentage of the 9 differential infiltrating immune cell types (The X-axis represents 5× normal samples and 6× OA samples, and the Y-axis represents the relative percentage of the 9 immune cell types in each sample; The coloured bars on the right represent the type of immune cells); (E) Heatmap of the 9 differential infiltrating immune cell types.
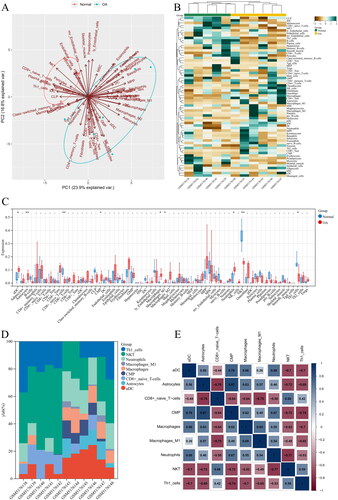
Figure 2. Up-regulated and down-regulated infiltrating immune cells in OA. Red represents the expression in normal tissues, and blue represents the expression in OA tissues. Up-regulated infiltrating immune cells in OA included (A) aDC; (B) CMP; (C) Macrophages M1; (D) Astrocytes; (E) Macrophages; (F) Neutrophils; while down-regulated infiltrating immune cells were (G) CD8+ naïve T cells;(H) NKT; (I) Th1 cells.
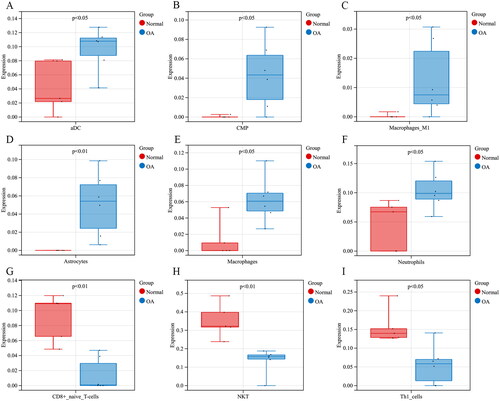
Figure 3. OA-related DEGs and IODEGs. (A) Volcano Plot of OA-related DEGs (VEGFA, FYN, IL6R, NRP1, and GREM1 were diagnostic biomarkers for OA); (B) Heatmap of OA-related DEGs; (C) Venn diagram of OA-related DEGs and immune-related genes retrieved from the ImmPort database; (D) Heatmap of 42 OA-related IODEGs.
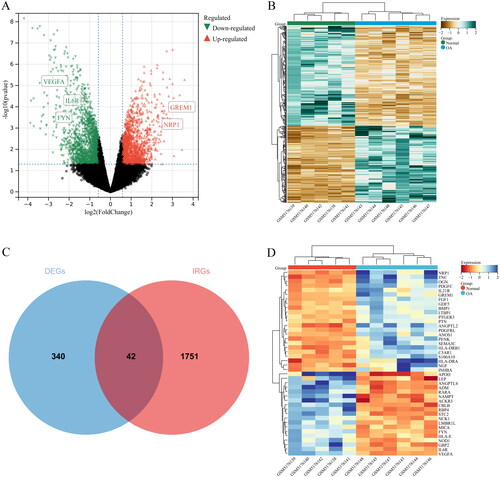
Table 2. IODEGs between OA and normal groups.
Figure 4. GO terms of the IODEGs from aspects of BP and CC. (A,B) Bubble Chart and Circle Graph of GO terms of the IODEGs from aspect of BP; (C,D) Bubble Chart and Circle Graph of GO terms of the IODEGs from aspect of CC.
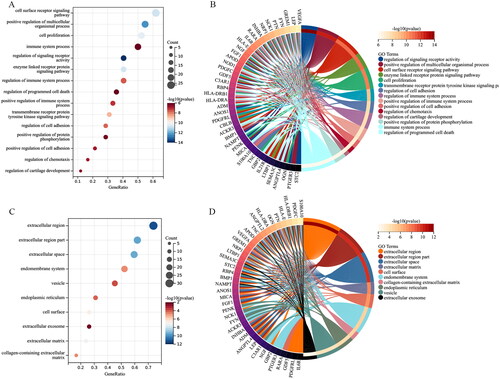
Figure 5. GO terms of the IODEGs from aspect of MF and KEGG pathways. (A,B) Bubble Chart and Circle Graph of GO terms of the IODEGs from aspect of MF; (C,D) Bubble Chart and Circle Graph of KEGG pathways of the IODEGs.
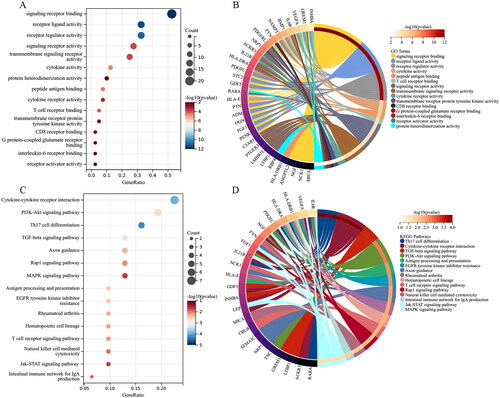
Figure 6. PPI network establishment. (A) PPI of the 42 IODEGs analyzed with the STRING database; (B) PPI network visualized by the Cytoscape, where red nodes represent up-regulated genes and green nodes represent down-regulated genes.
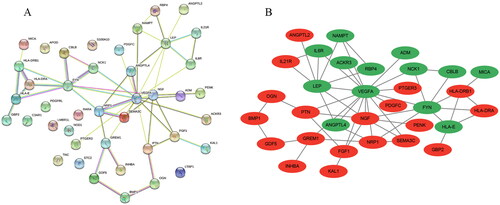
Figure 7. Screening of Hub genes based on the 8 algorithms as implemented by the plug-in CytoHubba. (A) MCC; (B) Degree; (C) EPC; (D) EcCentricity; (E) BottleNeck; (F) Closeness; (G) Radiality; (H) Betweenness. The rank of protein is indicated by colour intensity (from yellow to red), i.e. a higher rank of protein is indicated by a darker red colour.
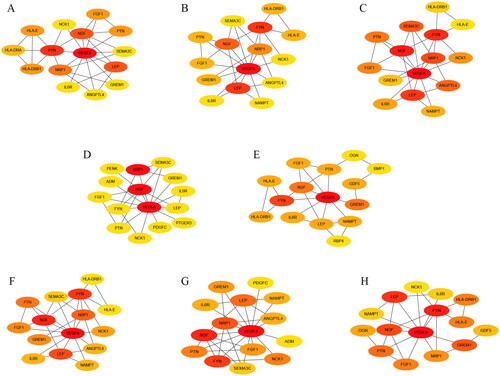
Figure 8. Identification and validation of Hub genes. (A) Identification of Hub genes with R package “UpSet”; (B) Heatmap of the 8 Hub genes in the GSE169077 datasets; (C,D) Boxplot and Heatmap of the 8 Hub genes in the GSE55235 and GSE55457 datasets.
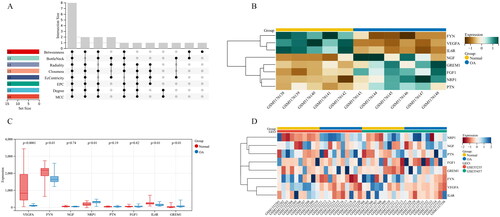
Figure 9. Validation of the 5 Hub genes in OA diagnosis in the GSE55235 and GSE55457 datasets with ROC curve analysis. (A) VEGFA; (B) FYN; (C) GREM1; (D) NRP1; (E) IL6R.
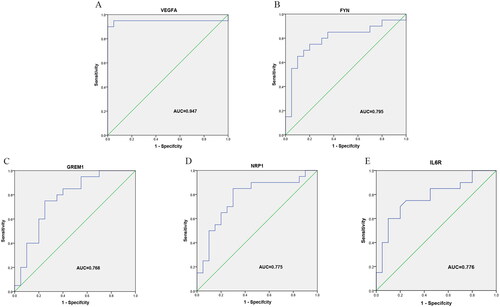
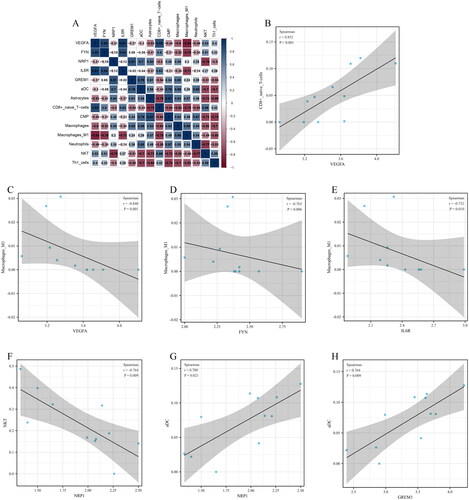
Figure 10. Relationship between candidate diagnostic biomarkers and differential infiltrating immune cell types. (A) Matrixplot of correlation coefficients; (B) VEGFA-CD8+ naïve T cells; (C) VEGFA-Macrophages M1; (D) FYN-Macrophages M1; (E) IL6R-Macrophages M1; (F) NRP1-NKT; (G) NRP1-aDC; (H) GREM1-aDC.
Data availability statement
The GSE169077, GSE55235 and GSE55457 datasets were publicly available and obtained from Gene Expression Omnibus (GEO, https://www.ncbi.nlm.nih.gov/geo/). The names of the repository and accession number(s) can be found in the online repositories.