
Figures & data
Figure 1. Schematic diagram of experimental grouping. C: control group; D: GDA-DBBF-HCHb group; G: GDA-HCHb group.
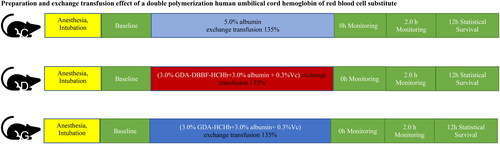
Table 1. Comparison of the main physical and chemical indicators of the two groups of products.
Table 2. Comparison of the main physical and chemical indicators of the two groups of products at 0 point and after 2 months.
Figure 2. Molecular weight distribution of DBBF cross-linked HCHb at different pH (n = 3).
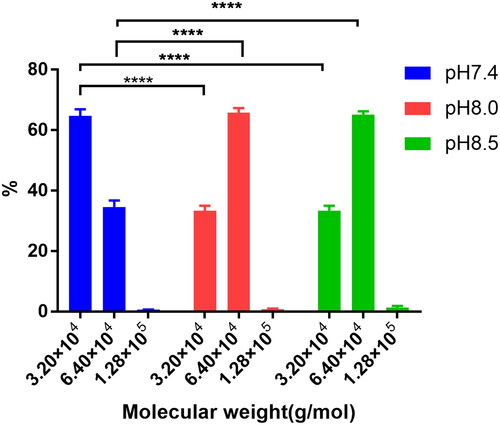
Figure 3. Molecular weight distribution of DBBF cross-linked HCHb under different IHP concentrations (CIHP) (n = 3).
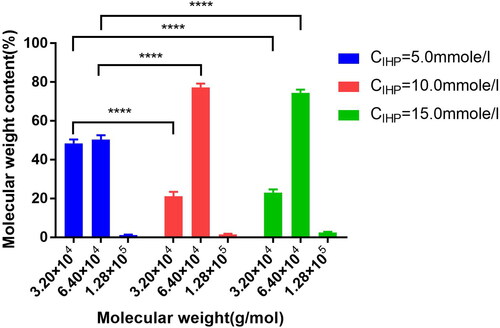
Figure 4. The molecular weight distribution of cross-linked HCHb under different mole ratios of DBBF and HCHb (Mole RatioDBBF:HCHb).
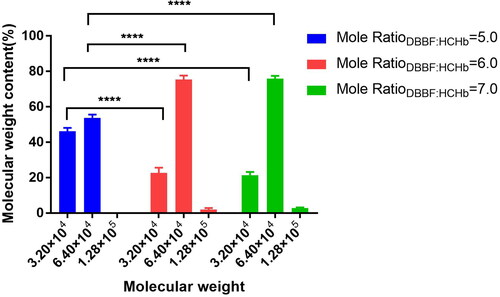
Figure 5. The P50 and Hill co (A) and MetHb (B) of DBBF-HCHb under different Mole ratiosDBBF: HCHb (n = 3).
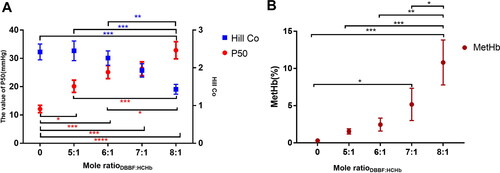
Figure 6. Molecular weight distribution of GDA-DBBF-HCHb under different mole ratios of GDA and DBBF-HCHb (n = 3).
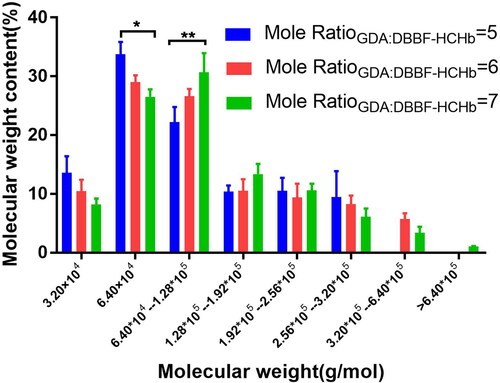
Figure 7. The P50 and Hill co (A) and MetHb (B) of DBBF-HCHb under different Mole ratiosGDA:DBBF-HCHb (n = 3).
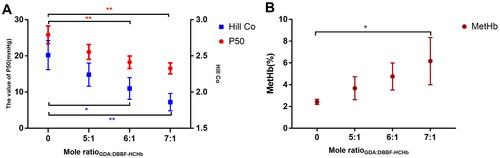
Figure 8. Comparison of percent survival within 12 h of three groups of rats after 135% exchange transfusion (n = 6).
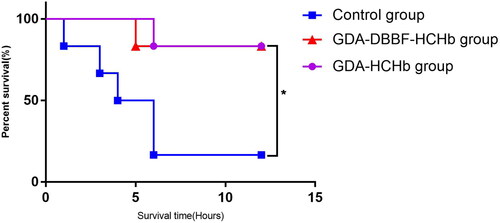
Figure 9. (A) TCO2, (B) PCO2, (C) HCO3−, (D) HCO3STD change at baseline, end of the ET (End), and after 2 h of ET (After 2 h) in three groups of rats (n = 6).
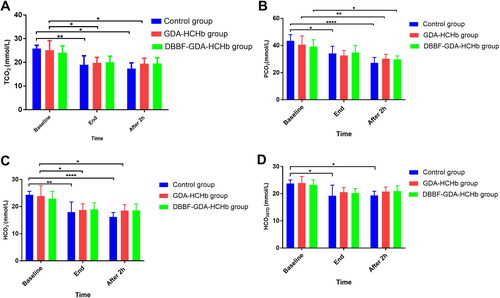
Figure 10. (A) HR and (B) MAP change at baseline, end, and after 2 h in three groups of rats (n = 6).
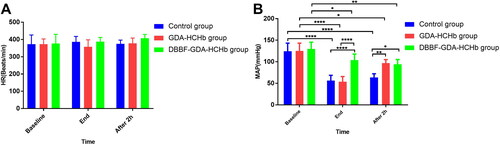
Figure 11. PO2 change at baseline, end of the exchange, and after 2 h of exchange in three groups of rats (n = 6).
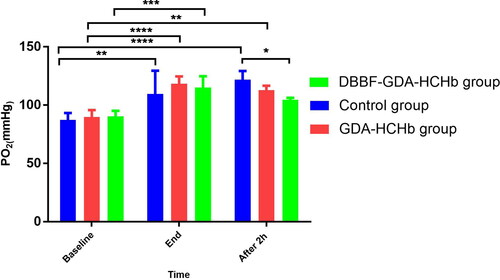
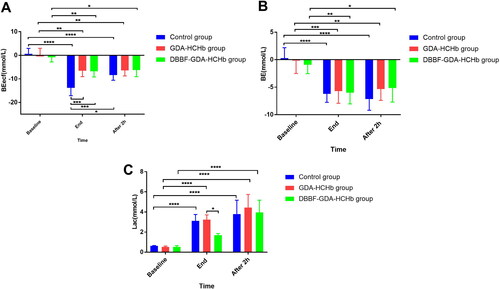
Figure 12. (A) BEecf, (B) BE and (C) Lac change at baseline, end, and after 2 h in three groups of rats (n = 6).
Supplemental Material
Download MS Excel (20.9 KB)Data availability statement
The authors confirm that the data supporting the findings of this study are available within the article and its supplementary materials.