
Figures & data
Figure 1. The total ion chromatogram of E. milii flowers extract presented the major identified metabolites (quinic acid, chlorogenic acid, quercetin-3-glucuronide, quercitrin, kaempferol-3-O-α-l-rhamnoside and naringenin according to the retention time) via LC–ESI-MS/MS in negative ion mode.
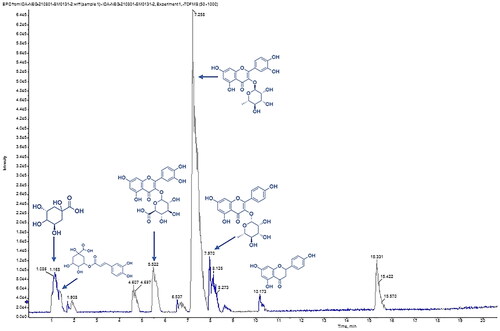
Table 1. Phytochemical profiling of E. milii by LC–MS/MS analysis (negative mode ESI).
Figure 2. Representative graphs of Malvern’s Zetasizer instrument showed measurements of (A) particle size and PDI and (B) ζ-potential values of PVA/PLGA NPs displaying good quality results.
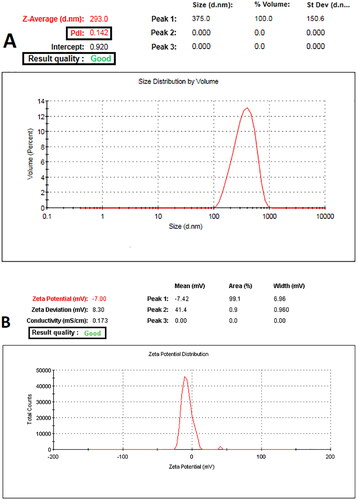
Table 2. Composition and physicochemical characterizations of electrosprayed PVA/PLGA NPs loaded with CGA.
Figure 3. Scanning electron micrographs of PVA/PLGA NPs (F2) were observed under (A) low magnification (×2000, scale bar 10 µm) and (B) high magnification (×5000, scale bar 5 µm).
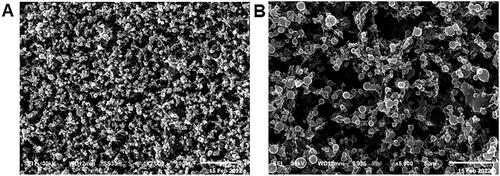
Figure 4. In vitro CGA release patterns of PVA/PLGA NPs (F1–F3, formula codes shown in ) in PBS (pH = 7.4). All data points are presented as mean ± SD for clarity. **F2 are shown as an optimized formula.
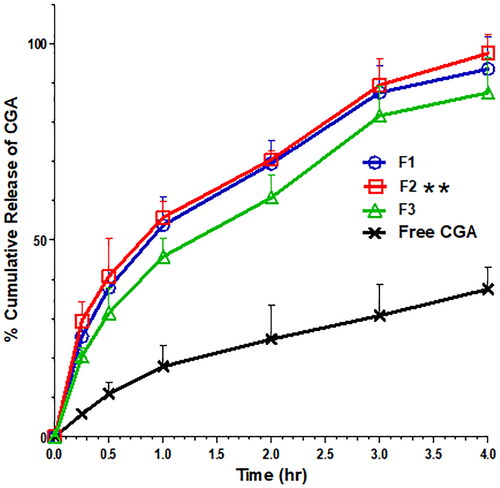
Figure 5. FTIR spectrum of free CGA, PLGA 50:50, PVA and PVA/PLGA NPs (F2).
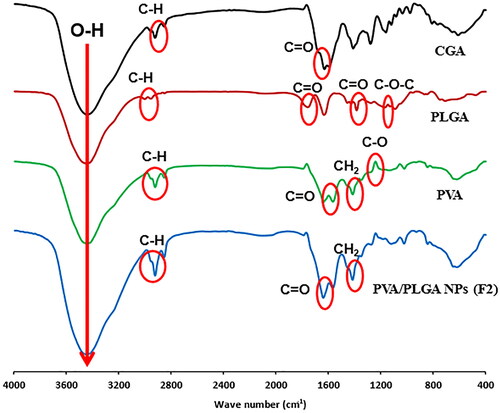
Figure 6. DSC thermograms for free CGA, PLGA 50:50, PVA and PVA/PLGA NPs (F2).
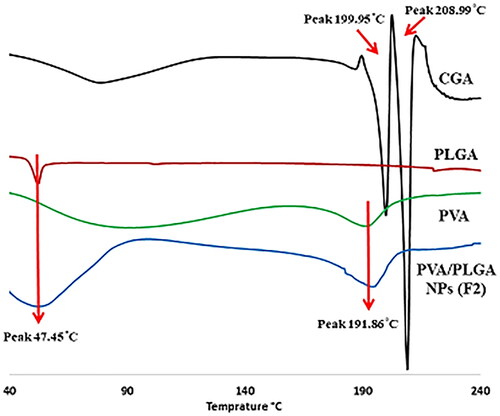
Figure 7. Bacterial burden in the lung tissues of the different experimental groups. *A significant difference (p < .05) between group I and group II.
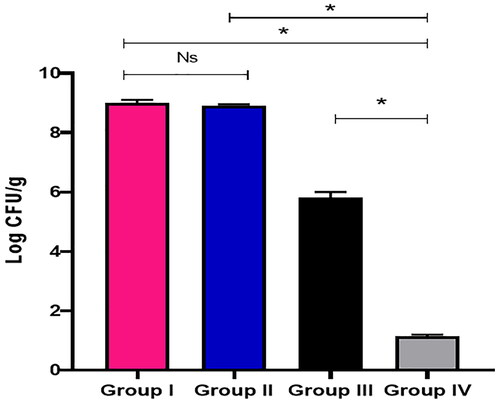
Figure 8. Kaplan–Meier’s survival curve for the experimental groups.
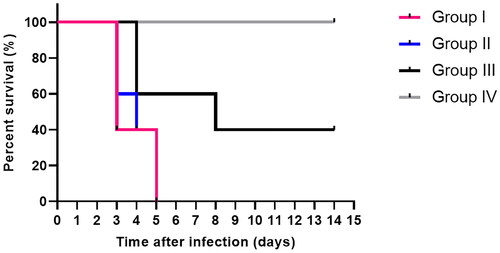
Figure 9. H&E stained lung sections of (A) group I showing dilated bronchioles (red arrows) with obvious inflammation (green arrows) and areas of congestion (black arrow) (×200). (B) Group II showed destructed and dilated bronchioles (blue arrows) surrounded by chronic inflammation (black arrow), alveolar fibrosis (red arrows) and congested vessel (green arrow) (×200). (C) Group III showed partial lessening of inflammation with average-sized bronchioles (black arrow) surrounded by average-sized alveoli (blue arrows) and few congested vessels (red arrow) (×200). (D) Group IV showing alveoli with normal size separated by fibrous septa (blue arrows) and bronchioles with normal size (black arrow) (×200). The TNF-α immunostaining of (E) group I displaying strong positive TNF-α immunostaining with score 3 (×100). (F) Group II displaying strong positive TNF-α immunostaining with score 3 (×100). (G) Group III displaying moderate positive TNF-α immunostaining with score 2 (×100). (H) Group IV displaying negative TNF-α immunostaining with score 0 (×100).
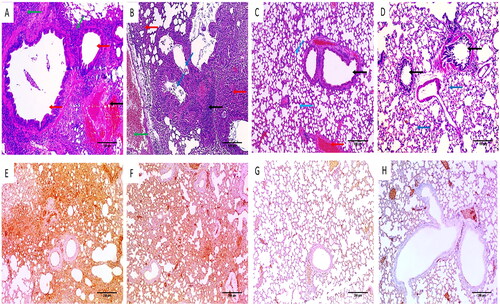
Figure 10. Cytotoxicity curve of (A) free CGA (with CC50 of 5.2 ± 0.4 mg/mL) and (B) PVA/PLGA NPs loaded with CGA, F2 (with CC50 of 480 ± 1.9 µg/mL).
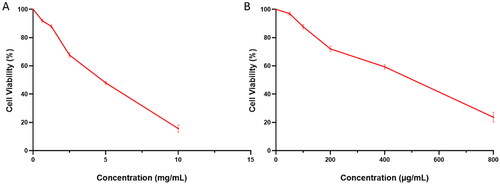
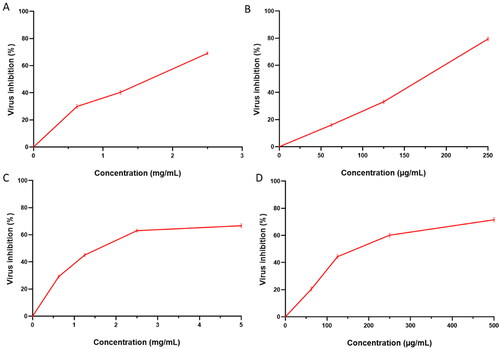
Figure 11. Antiviral activity of (A) the free CGA (with IC50 of 1.8 ± 0.1 mg/mL) and (B) PVA/PLGA NPs loaded with CGA (with IC50 of 170 ± 1.1 µg/mL) against the low pathogenic human coronavirus (HCoV-229E). Antiviral activity of (C) the free CGA (with IC50 of 2.1 ± 0.09 mg/mL) and (D) PVA/PLGA NPs loaded with CGA (with IC50 of 223 ± 0.88 µg/mL) against MERS-CoV (NRCEHKU270).
Supplemental Material
Download MS Word (90.2 KB)Data availability statement
The data supporting the findings of this study are available within the article (and/or) its supplementary materials.