
Figures & data
Table 1. The HEX server and AutoDock Vina docking score of Compound 1 to 10 with tubulin protein.
Figure 1. (a) Ramachandran Plot obtained from MOLprobity for tubulin protein showing favourable and poor rotamers. (b) ProSA plot (number of residues along x-axis and Z-score along y-axis) showing the protein structure (black dot) accommodated in X-ray zone. (c) 3D structure of protein derived from Chimaera showing blue-coloured Chain A and orange-coloured Chain B. The ligands are presented in ball model. (d) Verify3D plot represented the average score for amino acid residues for Chain A lying in between 0 to 0.1 Å. (e) Verify3D plot represented the average score for amino acid residues for Chain B lying in between 0 to 0.1 Å.
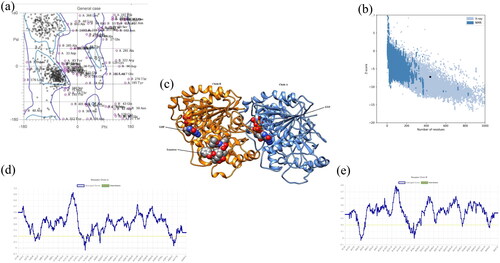
Figure 2. (a) Docked complex of Compound 2 with tubulin protein. The CPK balls represent the ligand and surface view for protein. (b) The zoomed-in view of docked ligand observed in the Biovia Discovery Studio Client. (c) The amino acid residues of protein interacting with Compound 1 shown: Dashed lines of Orange color for electrostatic interactions, green colour for hydrogen bond, purple colour for hydrophobic interaction and cyan colour for halogen bond. (d) H-bond donor and acceptor residues are shown in surface view: purple colour indicates donor and green colour indicates acceptor.
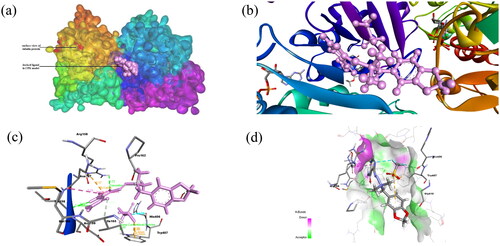
Figure 3. (a) Docked complex of Compound 2 with tubulin protein. The CPK balls represent the ligand and surface view for protein. (b) The zoomed-in view of ligand in docked complex observed in Biovia Discovery Studio Client. (c) The amino acid residues of protein interacting with Compound 2 shown: Dashed lines of Orange color for electrostatic interactions, green colour for hydrogen bond, purple colour for hydrophobic interaction and cyan colour for halogen bond. (d) H-bond donor and acceptor residues are shown in surface view: purple colour indicates donor and green colour indicates acceptor.
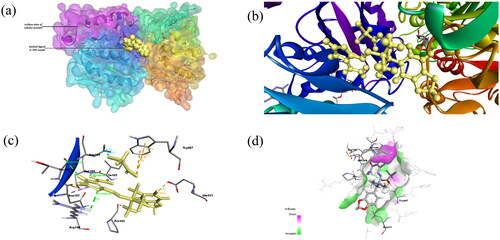
Table 2. Binding interactions of ligand with tubulin protein observed in PLIP server.
Table 3. Lipinski Parameters observed for all compounds.
Figure 4. The Bioavailability Radar displayed for a rapid appraisal of drug-likeness of the compounds considering the parameters lipophilicity, size, polarity, insolubility, insaturation and flexibility.
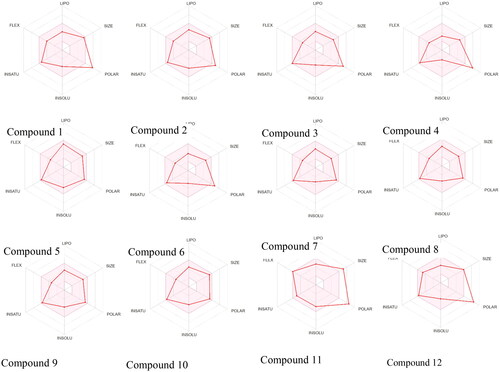
Figure 5. BOILED-Egg Model for designed compound 1 to compound 12 observed in SwissADME web server. The yellow region indicates blood brain barrier permeability, white region indicates human intestinal absorption, the blue colour of dot represents p-glycoprotein substrate.
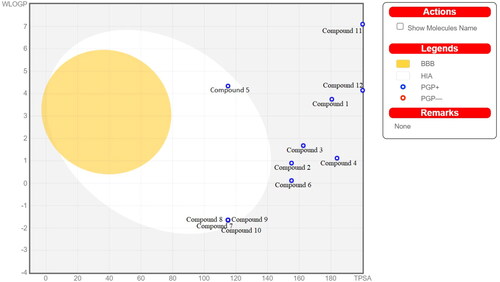
Figure 6. The prediction results of ADMET properties of ligands (Compound 1 to Compound 12) using pkCSM. (a) The blue colour represents the water solubility in log mol/litre and red colour for Caco2 permeability measured in log papp. (b) The percentage of the compound absorbed through human intestine. (c) The blue colour indicated the VDss measured in log L/kg; red bars for Fraction unbound; green bars represented the blood brain barrier permeability in logBB terms and blue bars for CNS permeability measured in terms of logPS. (d) The parameters for toxicity are shown by coloured bars; blue for maximum tolerated dose, Orange for Oral Rat acute toxicity, grey for Oral Rat chronic toxicity and yellow for minnow toxicity.
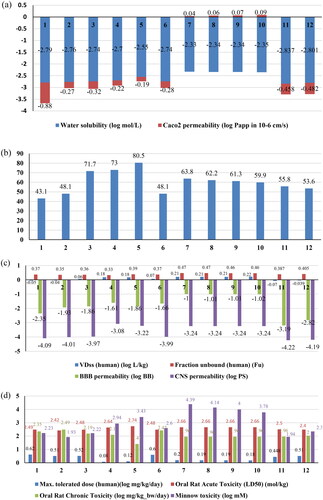
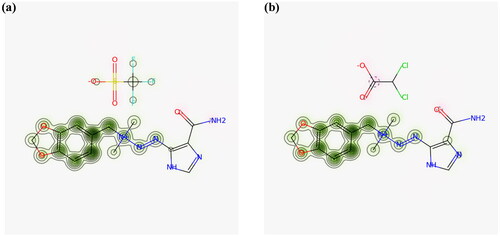
Figure 7. (a) Predicted probability map for Compound 1 (b) predicted probability map for Compound 2. The pink atoms contribute to decrease of hERG blockage while green atoms represent contribution towards blockage and grey denotes no contribution.
Data availability statement
The data that support the findings of this research are available upon reasonable request from the corresponding author R. Tomar.