
Figures & data
Figure 1. Schematic representation of dasatinib-loaded hybrid exosome construction. Exosomes were collected from cell culture supernatant after 48 h by combination ultracentrifugation with ExoQuick precipitation method. Dasatinib liposomes were prepared by thin film lipid hydration followed by sonication and extrusion. Exosomes were fused with dasatinib-liposomes via 10 freeze-thaw cycles.
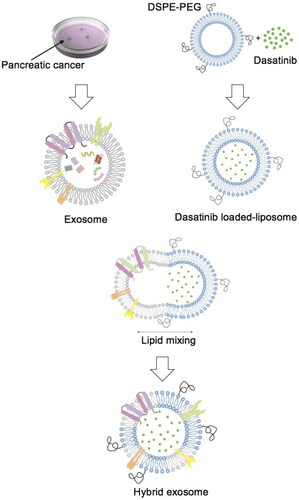
Figure 2. Characterisation of hybrid exosomes. The particle sizes (A) and zeta potentials (B) of liposomes, exosomes, and hybrid exosomes. Data were expressed as the mean ± SD (n = 3), *p < .05. (C) Protein expressions of CD9, C81 and GAPDH in cells, exosomes and hybrid exosomes derived either from Panc0403 or HuP-T3 in Western blot analysis. Images are representative of three independent experiments.
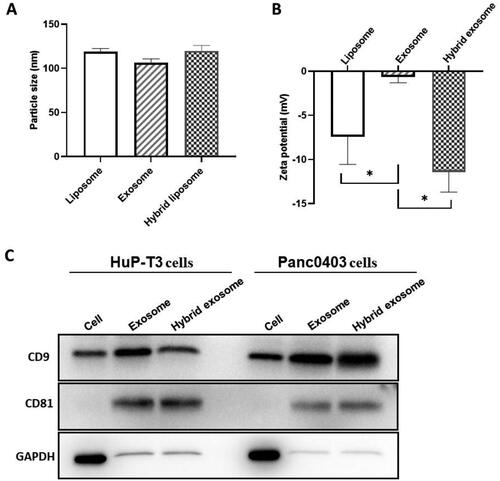
Figure 3. Evaluation of membrane fusion of exosomes with liposomes. (A) Colocalization of cancer-derived exosomes and liposomes in hybrid exosomes by total internal reflection fluorescence microscopy (TIRFM). The green fluorescence indicates coumarin 6-labelled liposomes, red fluorescence indicates DiD-labelled exosomes extracted from HuP-T3 and Panc0403 cells respectively, and orange merged fluorescence indicates colocalization of exosomes and liposomes. Images are representative of three independent experiments. Scale bar, 1 μm. (B) The fusion curve of hybrid exosomes derived from HuP-T3 cells and Panc0403 cells by fluorescence resonance energy transfer (FRET) assays followed with (C) Quantitative analysis of FRET efficiency for the blank liposome and hybrid exosomes. Lipid dilution ratio is used to define the membrane fusion efficiency. The lipid dilution ratio of labelled liposomes is calculated through standard curve created by plotting FRET efficiency (EFD) vs lipid dilution ratio. Liposomes labelled with 1 mol%NBD-DMPE and rho-DMPE (1:1 v/v) was fused with exosomes though freeze-thaw method, and the fluorescence intensities of the mixture were analysed at 530 and 588 nm. Data were expressed as the mean ± SD (n = 3), ***p < .001.
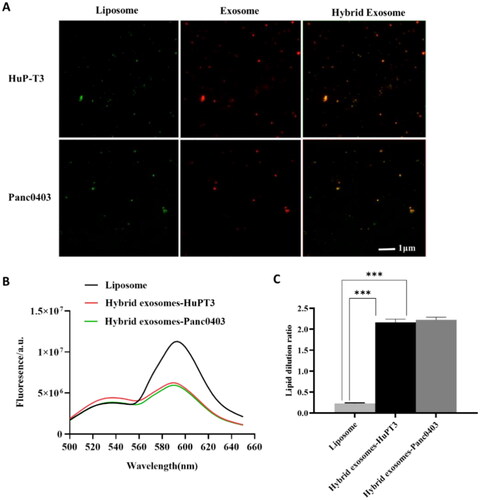
Figure 4. In vitro release kinetics of dasatinib from liposome, HuPT3-derived hybrid exosomes (A) and Panc0403-derived hybrid exosomes (B) in PBS buffer with pH 5.5 and pH 7.4 at 37 °C. At each predetermined interval, 200 μl of each sample was determined for absorbance detection at 322 nm and replaced with equal volume of respective buffers. The absorbance was translated to dasatinib concentration using a standard curve prepared through serial dilutions of dasatinib, followed by quantification of cumulative dasatinib release rate. Each experiment was repeated for triplicate.
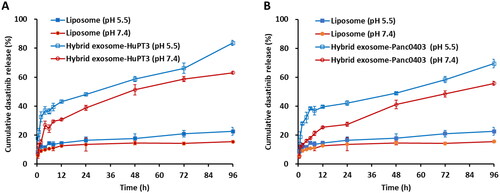
Figure 5. Analysis cellular uptake of hybrid exosomes in HuP-T3 cells (left panels) and Panc0403 cells (right panels) by flow cytometry. Coumarin 6 is used as fluorescence probe to determine uptake ratio. Treated with different types of formulations for 4 h, two cell lines were collected for FITC detection. The influences of PEG modification and cellular heterogeneity on cellular uptake after incubated different types of hybrid exosomes in HuP-T3 (Left panels of ) and Panc0403 (Right panels of ) cells. The cellular uptake efficiency of various coumarin 6 formulations in HuP-T3 (Left panel of ) and Panc0403 (Right panel of ) cells. NEG means negative control, H means HuP-T3 cells, P means Panc0403 cells. Data were expressed as the mean ± SD (n = 3). *p < .05, **p < .01, ***p < .001.
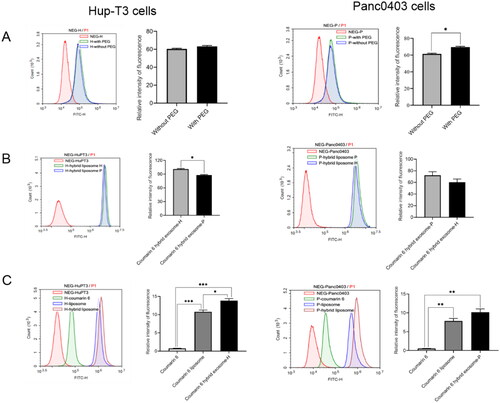
Figure 6. Representative images of HuP-T3 cells (A) and Panc0403 cells (B) treated with free coumarin 6, coumarin 6 liposomes and coumarin 6 hybrid exosomes, respectively. After incubation with the various coumarin 6 formulations for 4 h, the cells were stained with DAPI and imaged by Cytation 1 automatic microplate reader. Blue colour indicates the nucleus of cells stained with DAPI. Green colour shows the drug in HuP-T3 cells or Panc0403 cells after applying various coumarin 6 formulations. The fluorescence intensity of the coumarin 6 in the HuP-T3 and Panc0403 cells was quantified using ImageJ software. Scale bar: 100 μm. Data were expressed as the mean ± SD (n = 3). *p < .05.
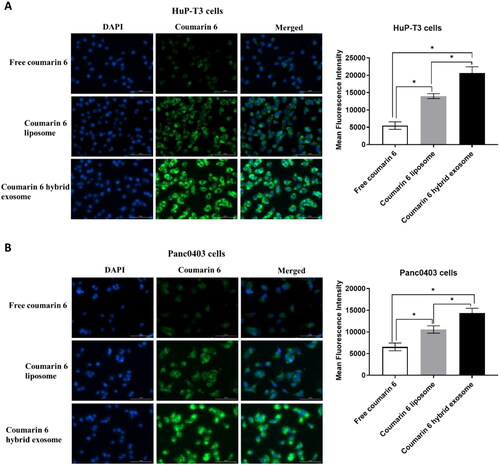
Figure 7. Effects on PDAC cell proliferation and apoptosis treated with different dasatinib formulations in vitro by MTS assay and flow cytometry analysis, respectively. Inhibitory proliferation detection of HuP-T3 cells (A) and Panc0403 cells (B) treated with different dasatinib formulations by MTS assay. These two types of cell lines were treated with free dasatinib, dasatinib liposomes and dasatinib hybrid exosomes at the concentration of 0.00137, 0.0137, 0.0412, 0.123, 0.37, 1.11, 3.3, 10 and 20 μmol/L dasatinib for 72 h, followed by incubating MTS agent for 2 h, respectively. The absorbance was determined at 490 nm. Data expressed as means ± SD (n = 3). *p < .05, indicates the comparison of dasatinib hybrid exosomes to dasatinib liposomes; # p < .05, indicates the comparison of dasatinib hybrid exosomes to dasatinib. Apoptosis assessment of HuP-T3 cells (C) and Panc0403 cells (D) treated with varying dasatinib samples at 1 μmol/L of dasatinib concentration for 24h by flow cytometry analysis. Data are shown as the mean ± SD. a, p < .05, compared with control; b, p < .05, compared with dasatinib group; c, p < .05, compared with dasatinib liposome group.
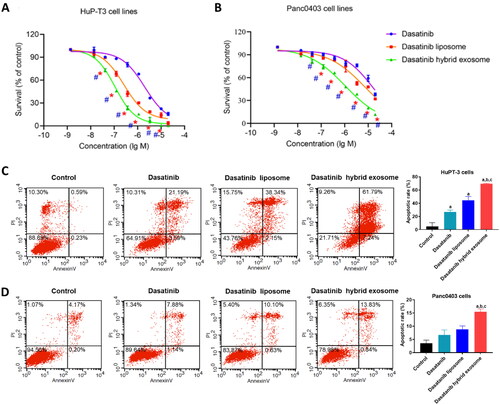
Table 1. Determination of drug likeness of dasatinib by lipinski’s rules.
Table 2. The physicochemical and ADMET properties of dasatinib.
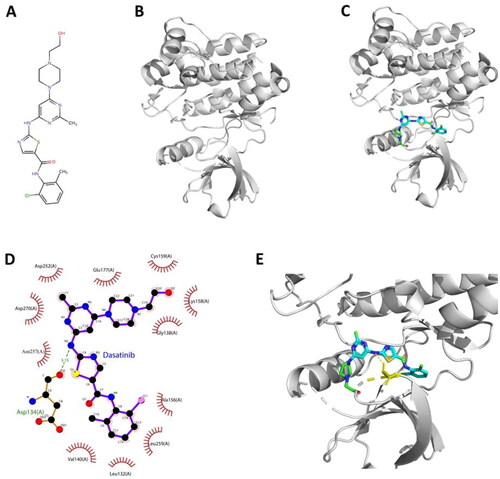
Figure 8. Interaction mode between dasatinib and ACK1 proposed by molecular docking analysis. (A) Chemical structure of dasatinib. (B) Chemical structure of ACK1 (PDB ID: 4HZR). (C) Binding pose of dasatinib – ACK1 complex. (D) Interaction profile of dasatinib – ACK1 complex. (E) Representative structure of dasatinib in the binding site of ACK1 kinase.
Data availability statement
The data that support the findings of this study are available from the corresponding author upon reasonable request.