
Figures & data
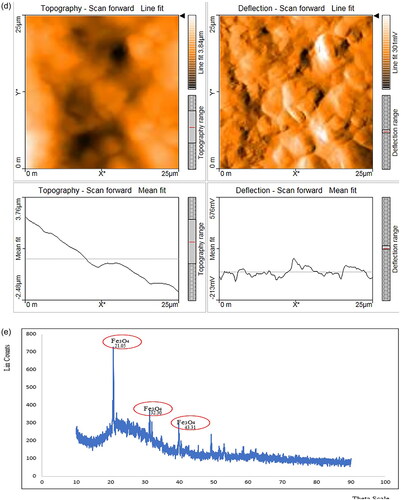
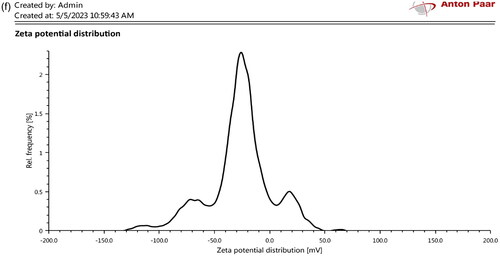
Figure 2. (a) Represents control- a microscopic image of magnetosomes, and (b) represents the conjugation of Mag-FITC analysed through fluorescence microscopy (c) schematic illustration of magnetosomes conjugation with FITC molecule.
Figure 3. FT-IR spectrum representing the chemical bonding between magnetosomes and fluorescein isothiocyanate.
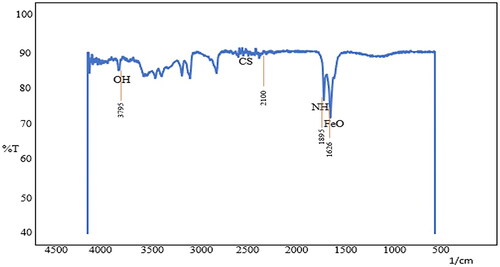
Figure 4. (a) Represents the control image of HeLa cell lines and (b) represents the magnetosome- FITC absorption process in HeLa cell lines recorded at 100 µg/mL Mag-FITC concentration.
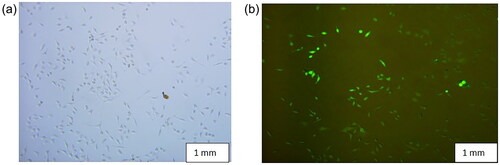
Figure 5. Mag-FITC cell uptake analysed through FACS analysis (a) control (magnetosomes) (b) 10 µg/mL Mag-FITC (c) 50 µg/mL Mag-FITC (d) 100 µg/mL Mag-FITC (e) 150 µg/mL Mag-FITC (f) 200 µg/mL Mag-FITC.
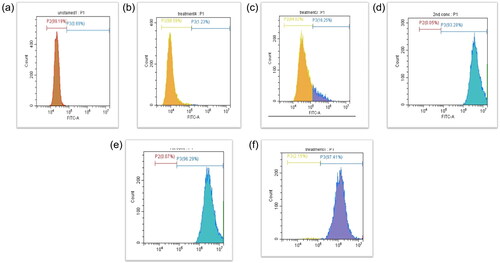
Figure 6. Biodistribution of Mag-FITC assessed at different time intervals (Scale bar: 5.0 cm) (a) control (sodium chloride) (5 min) (b) control (sodium chloride) (2 h) (c) 5 min (d) 30 min (e) 60 min (f) 90 min (g) 12 h (h) 24 h (i) 36 h (j) 48 h (k) 60 h (l) 72 h.
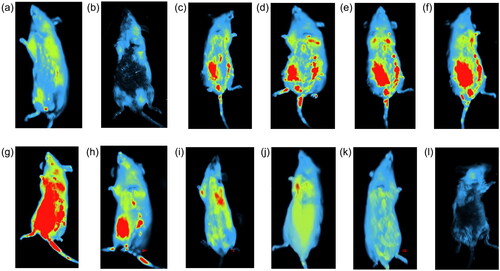
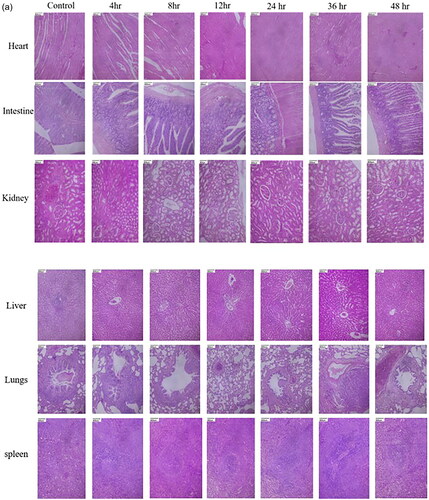
Figure 8. Detection of iron in serum sample measured with respect to time.
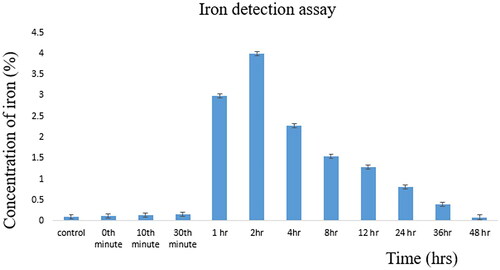
Figure 9. Detection of iron in (a) urine (b) faeces through flame atomic absorption spectrometry revealing the elimination of iron from the sample within 48 h.
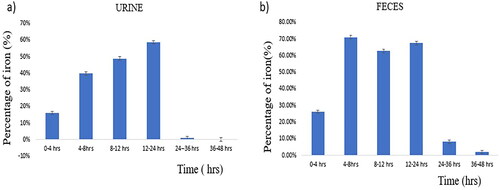
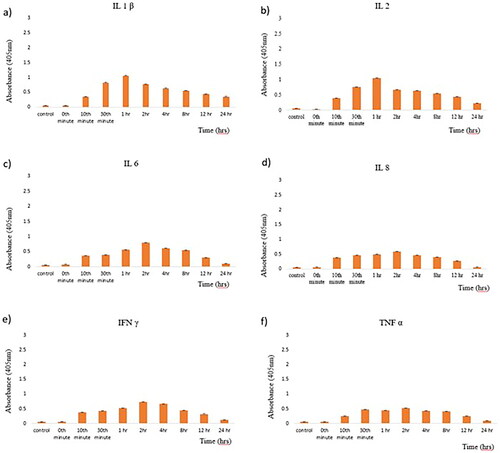
Figure 10. Immunogenicity of magnetosomes tested using Indirect Elisa (a) IL 1β (b) 1 L 2 (c) IL 6 (d) IL 8 (e) IFN γ (f) TNF α.
Data availability statement
The authors confirm that the data supporting the findings of this study are available within the article.