
Figures & data
Figure 1. A) Custom-designed holder to locate six eggs for efficient radiation dose delivery. B) Dose distribution on the six eggs holder. C) Scheme of the experimental set up. At EDD10 the eggs were randomized and distributed in three groups for topical administration of medium (control), cisplatin and NAs. Radiotherapy was delivered at EDD11. Tumours were monitored until EDD14.
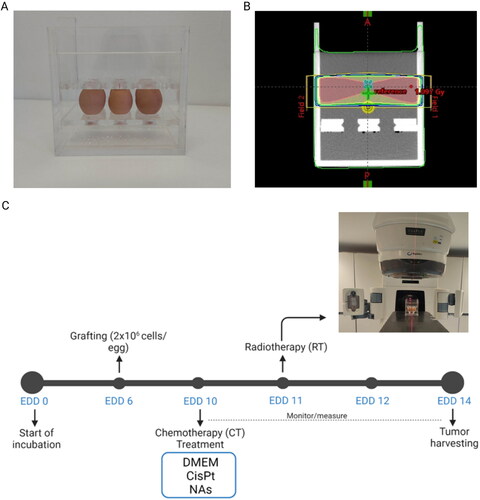
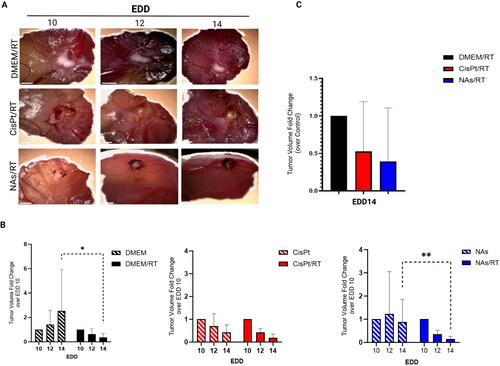
Figure 2. A) Example of tumour-grafted CAMs during the experimental window. Images were taken with a portable digital microscope (DinoLite). Scale bar = 2 mm. B) Comparison between the non-irradiated and irradiated groups. The data are reported as mean ± SD of 2 independent experiments. N = at least 3 eggs per condition. Statistical analysis was performed by two-way ANOVA (Mann–Whitney test). *p < 0.05, **p < 0.005. C) Comparison of each CT + RT treatment vs. RT group. Tumour volume fold change was calculated over the EDD14.
ianb_a_2309233_sm5605.jpg
Download JPEG Image (441.1 KB)
ianb_a_2309233_sm5609.jpg
Download JPEG Image (636.2 KB)
ianb_a_2309233_sm5583.jpg
Download JPEG Image (524 KB)
ianb_a_2309233_sm5496.jpg
Download JPEG Image (602.4 KB)
ianb_a_2309233_sm5283.jpg
Download JPEG Image (691.1 KB)
ianb_a_2309233_sm5580.jpg
Download JPEG Image (567.1 KB)
ianb_a_2309233_sm5453.jpg
Download JPEG Image (481.8 KB)
ianb_a_2309233_sm5162.docx
Download MS Word (2.9 MB)ianb_a_2309233_sm5578.jpg
Download JPEG Image (610.2 KB)
ianb_a_2309233_sm5274.jpg
Download JPEG Image (369 KB)
Data availability statement
All data underlying the study are available upon request to the corresponding Authors.