
Figures & data

Figure 1. Decellularization of liver in (A) rat and (B) mice.
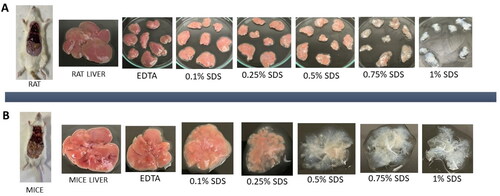
Table 1. Comparison of weight reduction in rat and mice liver post decellularization.
Figure 2. Histological characterisation of native and decellularized tissue. (A) Rat native liver tissue at 20X magnification, (B) Rat native liver tissue at 40X magnification, (C) Rat decellularized liver tissue at 20X magnification, and (D) Rat decellularized liver tissue at 40X magnification.
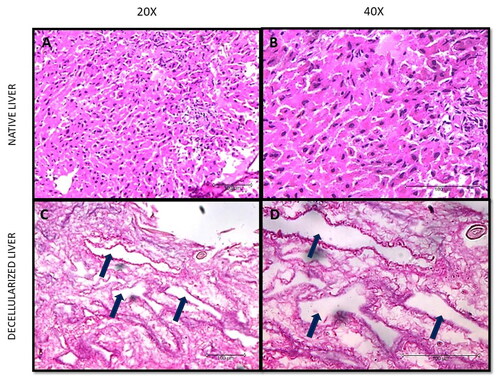
Table 2. Comparison of residual DNA content in rat and mice liver post decellularization.
Table 3. Comparison of total protein content in rat and mice liver post decellularization.
Table 4. Comparison of sGAG content in rat and mice liver post decellularization.
Figure 3. Histological characterisation of native and decellularized tissue. (A) Mice native liver tissue at 20X magnification, (B) Mice native liver tissue at 40X magnification, (C) Mice decellularized liver tissue at 20X magnification, and (D) Mice decellularized liver tissue at 40X magnification.
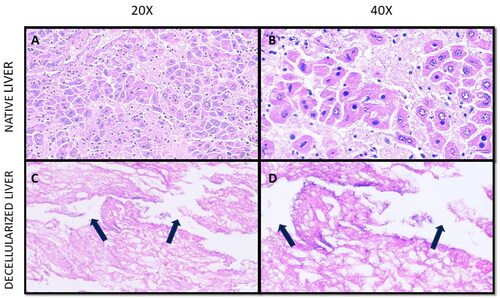
Figure 4. Scanning Electron Micrograph acquired at 10 kV (A) Rat native liver tissue at 500X magnification, (B) Rat native liver tissue at 1000X magnification, (C) Rat decellularized liver tissue at 500X magnification, and (D) Rat decellularized liver tissue at 1000X magnification.
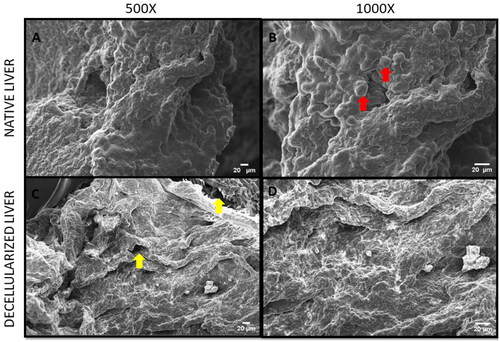
Figure 5. Scanning Electron Micrograph acquired at 10 kV (A) Mice native liver tissue at 500X magnification, (B) Mice native liver tissue at 1000X magnification, (C) Mice decellularized liver tissue at 500X magnification, and (D) Mice decellularized liver tissue at 1000X magnification.
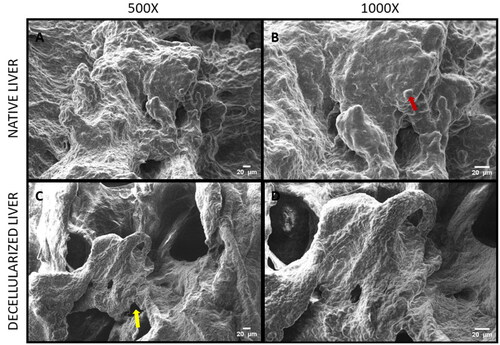
Figure 6. Quantification of DNA in decellularized rat and mice liver. (A) Residual DNA content (*p < .05, ****p < .0001) and (B) DNA gel electrophoresis.
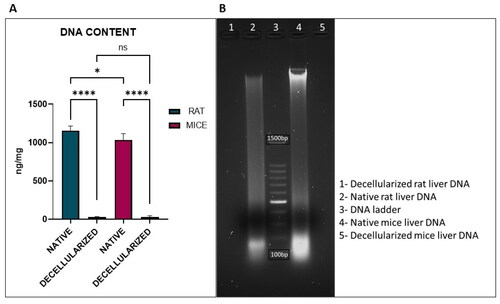
Figure 7. SDS PAGE to determine protein molecular weight distributions in the decellularized liver tissues of rat and mice.
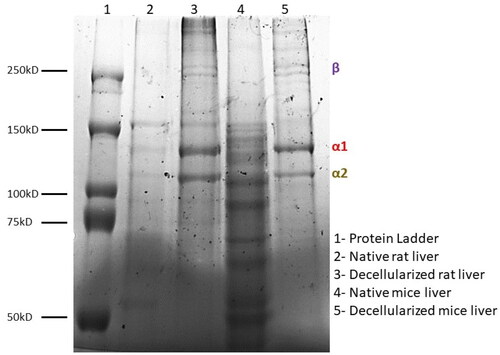
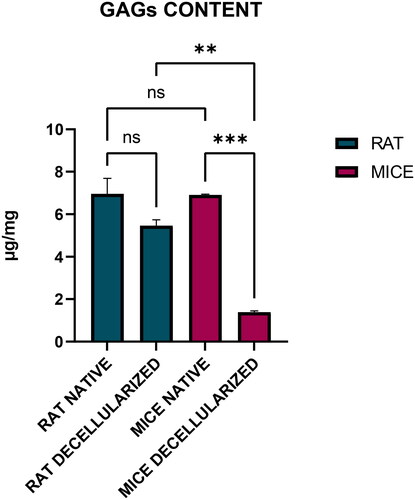
Figure 8. Estimation of sGAG content in decellularized rat and mice liver (**p < 0.05, ***p < .001).
Data availability statement
The authors confirm that the data supporting the findings of this study are available within the article.