Figures & data
Figure 1. Anti-SWuhan IgG and NAb responses in macaques with mild or severe SIV infection. a. Schematic diagram of the timeline for vaccination and detection. Fourteen SIV-infected rhesus macaques not on ART were divided into SIVlow (n = 6; mean viral load: 3.4 log RNA copies per ml plasma; range: 2.0-4.7) and SIVhi (n = 8; mean: 6.2; range: 5.0-7.7) groups. Six uninfected macaques were used as healthy controls (SIVneg). All the macaques received two intramuscular injections with 1 × 10¹¹ vp of Ad5-S at weeks 0 and 14. At weeks 0, 2, 4, 6, 14, 16, 18, 20, and 31, serum samples and PBMCs were collected and subjected to virological and immunological analysis. Green arrows indicate the time points of vaccination. Major health indicators were monitored over the course. b-d. Kinetics of anti-SWuhan IgG antibody response in SIVneg (b), SIVlow (c), and SIVhi (d) macaques. The endpoint IgG titres against the S protein of the SARS-CoV-2 Wuhan strain are shown. The limit of detection is 1:400. Overlapped data points represent the same values. Comparisons were conducted between week 2, 4, 6, 14 and week 0 (*, **, ***) or between week 16, 18, 20, 31 and week 14 (#, ##, ###) by paired, one-tailed Student’s t-test. Green arrows indicate the time points of vaccination. The shaded grey area indicates the period after the booster vaccination. Macaque RM18 died at week 8 due to severe SIV infection and was marked as gray dots. e, f. NAb responses against Wuhan strain and VOCs in each group at week 4 (e) and week 18 (f). S-pseudotyped vesicular stomatitis viruses assessed serum samples. The limit of detection is 1:30. Comparisons of the NAb titres against each strain in the same group were conducted by paired, one-tailed Student’s t-test (#, ##, ###). Comparisons of the NAb titres against the same strain in SIVneg or SIVlow group versus SIVhi group were conducted by unpaired, one-tailed Student’s t-test (*, **, ***). All the data points represent the mean values of two technical replicates. * or #, p < 0.05; ** or ##, p < 0.01; *** or ###, p < 0.001; ns, no significance.
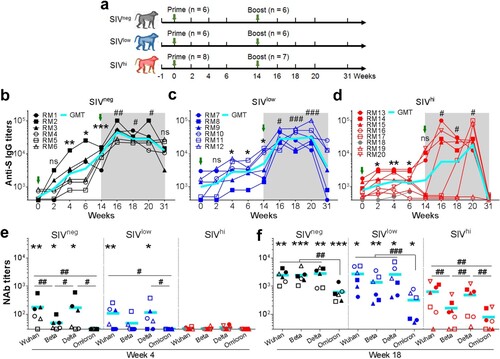
Figure 2. Anti-RBDWuhan IgG responses in macaques with mild or severe SIV infection. a-c. kinetics of anti-RBDWuhan IgG titres in SIVneg (a), SIVlow (b), and SIVhi (c) macaques. The endpoint IgG titres against SARS-CoV-2 Wuhan strain are shown. The limit of detection is 1:400. Overlapped data points represent the same values. Comparisons were conducted between weeks 2, 4, 6, 14, and week 0 (*, **) or between weeks 16, 18, 20, 31, and week 14 (#, ##) by paired, one-tailed Student’s t-test. Green arrows indicate the time points of vaccination. The shaded grey area indicates the period after the booster vaccination. d. Comparisons of the anti-RBDWuhan IgG titres between groups at weeks 6, 18, 20, and 31. Comparisons were performed by unpaired, one-tailed Student’s t-test. e, f. Anti-RBD IgG responses against Wuhan strain and VOCs in each group at week 4 (e) and week 18 (f). Comparisons of the anti-RBD IgG titres against each strain in the same group were conducted by paired, one-tailed Student’s t-test (#, ##, ###). Comparisons of the anti-RBD IgG titres against the same strain in SIVneg or SIVlow group versus SIVhi group were conducted by unpaired, one-tailed Student’s t-test (*, **, ***). All the data points represent the mean values of two technical replicates. * or #, p < 0.05; ** or ##, p < 0.01; *** or ###, p < 0.001; ns, no significance.
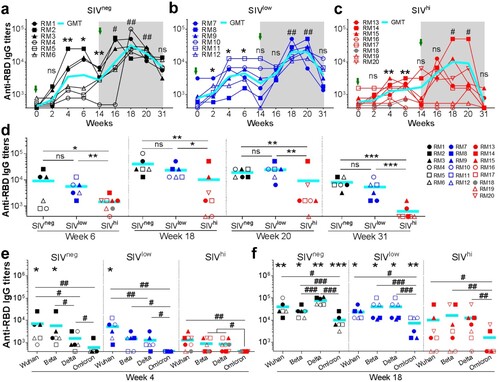
Figure 3. SARS-CoV-2 specific B cell responses, and correlation analysis of NAb titres versus SIV viral loads and CD4+ T cell populations. a, b. Antibody-secreting B cells (ASCs) specific for SWuhan (a) and RBDWuhan (b) in PBMCs collected at 4 days after the booster vaccination. PBMCs were stimulated with recombinant S or RBD proteins of SARS-CoV-2 Wuhan strain. IgG-secreting B cells were measured by ELISpot. c, d. Memory B cells (Bmem) specific for SWuhan (c) and RBDWuhan (d) in PBMCs were collected at 6 weeks after the booster vaccination (week 20). PBMCs were incubated with recombinant human IL-2 and R848 for 5 days followed by stimulation with recombinant S or RBD proteins of SARS-CoV-2 Wuhan strain. The IgG-secreting memory B cells were measured by ELISpot. The frequencies (left) and representative wells (right) are shown. Comparisons between groups were performed by unpaired, one-tailed Student’s t-test. *, p < 0.05; ns, no significance. e. Correlations between the NAb titres at week 18 versus the virological and immunological parameters (left to right: SIV viral loads, CD4/CD8 ratios, the counts of total CD4+ T cells, TFH cells, and CD4+ Tcm cells) at week 14. The best fit lines, r values, and p values are shown.
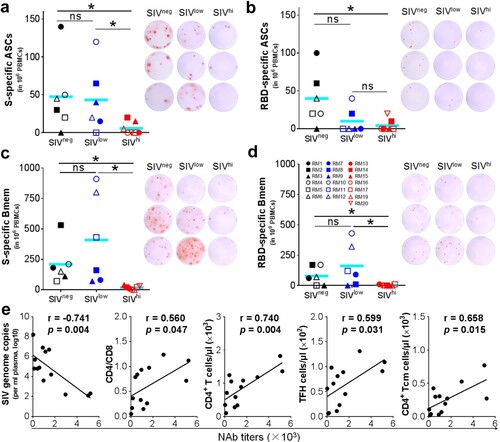
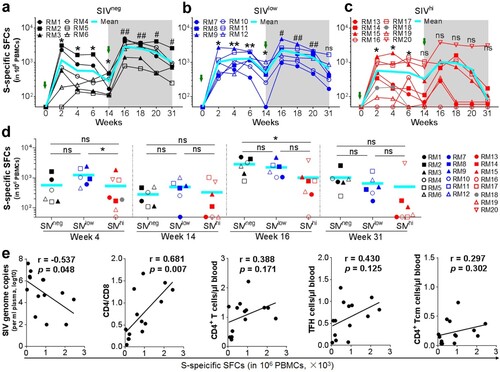
Figure 4. SWuhan-specific CMI responses in macaques with mild or severe SIV infection. a-c. Kinetics of SWuhan-specific IFN-γ-secreting cells in SIVneg (a), SIVlow (b), and SIVhi (c) macaques. PBMCs were collected at the indicated time points and stimulated with overlapped peptide pools corresponding to the S1 and S2 subunits of the S protein of SARS-CoV-2 Wuhan strain. IFN-γ-secreting spot-forming cells (SFCs) were examined by ELISpot. S-specific SFCs were calculated as the sum of those specific for S1 and S2. Overlapped data points represent the same values. A Shaded grey area indicates the period after the booster vaccination. Comparisons were conducted between weeks 2, 4, 6, 14, and week 0 (*, **) or between weeks 16, 18, 20, 31, and week 14 (#, ##) by paired, one-tailed Student’s t-test. The mean values and statistics in (c) were calculated without the data from the outlier macaque RM20. d. Frequencies of IFN-γ-secreting SFCs in each group at weeks 4, 14, 16, and 31. Comparisons between groups at each time point were performed by unpaired, one-tailed Student’s t-test. Mean values and statistics at weeks 16 and 31 were calculated without the data from the outlier macaque RM20. e. Correlations between the frequencies of SWuhan-specific SFCs at week 4 versus the virological and immunological parameters (left to right: SIV viral loads, CD4/CD8 ratios, the counts of total CD4+ T cells, TFH cells, and CD4+ Tcm cells) at week 0. The best fit lines, r values, and p values are shown. * or #, p < 0.05; ** or ##, p < 0.01; ns, no significance.