Figures & data
Figure 1. Profiles of active hepatitis patients during the period of observation. Hepatitis E virus (HEV)-related markers were measured in serial serum samples from active hepatitis patients; markers of hepatitis A virus (HAV), hepatitis B virus (HBV), and hepatitis C virus (HCV) were identified in the serum samples of patients at presentation. HBsAg: hepatitis B surface antigen. Anti-HBc IgM: anti-hepatitis B core protein IgM. Anti-HAV IgM: anti-hepatitis A virus IgM. Anti-HCV: anti-hepatitis C virus antibodies. Anti-HEV IgG-R: a ≥ 4-fold rise in anti-HEV IgG levels.
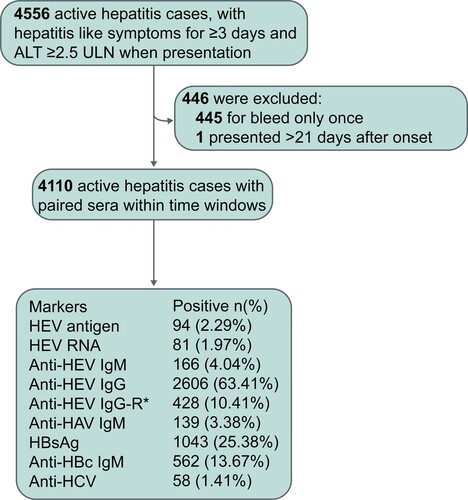
Figure 2. A schematic of how different groups of active hepatitis patients were defined. Among the 4,110 active hepatitis cases, 98 were identified as cases of hepatitis E. RNA: HEV RNA; Ag: HEV antigen; IgM: anti-HEV IgM; IgG-R: a ≥ 4-fold rise in anti-HEV IgG levels.
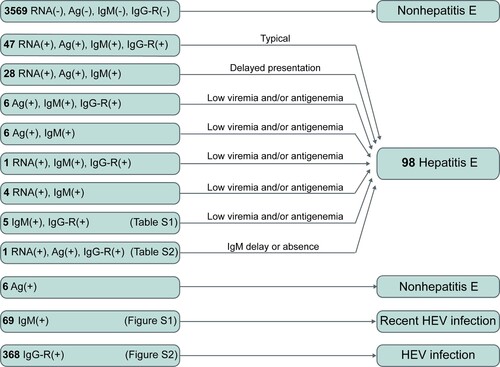
Figure 3. Phylogenetic tree based on partial open reading frame-1 nucleotide sequences from hepatitis E cases. Sixty-four sequences obtained from 58 hepatitis E cases are shown as blue dots. Viral sequences were obtained from serum samples collected from the 53 patients at presentation. Sequences were isolated from serum samples collected at presentation as well as from a second collection (in 4 patients) or from three serum samples (one patient). Accession numbers for the reference sequences are provided. The phylogenetic tree was constructed with the neighbor-joining method.
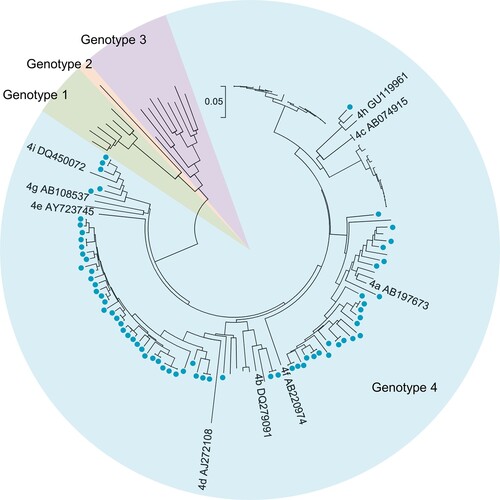
Table 1. Characteristics of hepatitis E patients, other viral hepatitis patients, and active hepatitis patients.
Figure 4. Dynamics of HEV-related markers in hepatitis E patients during disease progression. Serum samples were collected from 98 hepatitis E patients within the 1st week of symptom onset (n = 81) and in the following intervals after symptom onset, the 2nd week (n = 22), 3rd week (n = 51), 4th week (n = 35), 5th week (n = 27), 6th week (n = 29), 7th week (n = 19), 8th week (n = 12), 9–10 weeks (n = 18), 11–12 weeks (n = 14), 3–14 weeks (n = 5), 15–16 weeks (n = 8), 17–20 weeks (n = 9), 21–24 weeks (n = 9), 25–28 weeks (n = 11), 29–32 weeks (n = 9), and ≥33 weeks (n = 20). Levels of alanine aminotransferase (ALT) (A), HEV RNA (B), anti-HEV IgM (C), HEV antigen (D), and anti-HEV IgG (E) in the different serum sample intervals are shown in terms of the range (whiskers), interquartile range (boxes) and median (line within the boxes) values. The dotted lines represent the cutoff levels of ALT, anti-HEV IgM, HEV antigen, and anti-HEV IgG. (F) The positive rates of HEV antigen, HEV RNA and anti-HEV IgM and the rate of abnormal ALT levels in each group. ALT levels ≥2.5-fold the upper limit of normal (ULN) were considered abnormal in this study.
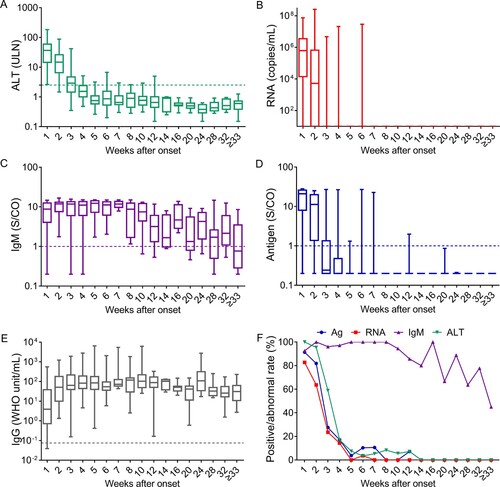
Figure 5. HEV RNA, HEV antigen, and anti-HEV IgM in the first serum samples collected from active hepatitis patients. # One hepatitis E patient showed HEV RNA positivity at presentation and anti-HEV IgM seroconversion and a ≥ 4-fold increase in anti-HEV IgG levels at follow-up. If HEV antigen and anti-HEV IgM were used as the first-line for the diagnosis of hepatitis E, this case would be considered non-hepatitis E at presentation. * Five hepatitis E cases presenting anti-HEV IgM and a ≥ 4-fold rise in anti-HEV IgG levels were identified to have a recent HEV infection at presentation and were confirmed as hepatitis E cases during follow-up. Ag: HEV antigen; IgM: anti-HEV IgM; RNA: HEV RNA.
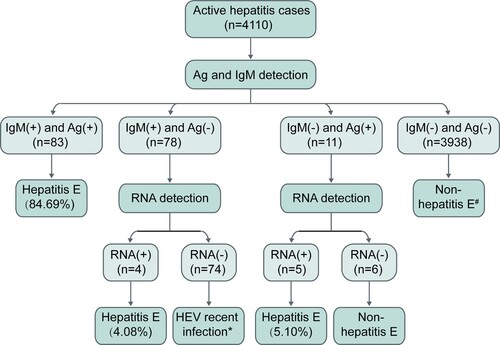
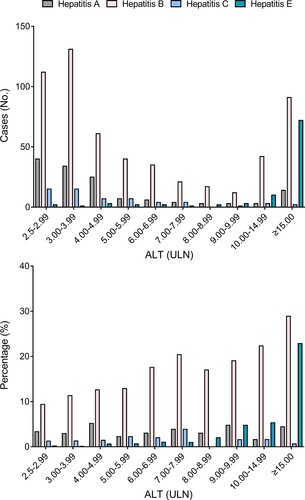
Figure 6. Rates of hepatitis E, hepatitis A, hepatitis B, and hepatitis C among active hepatitis patients with different alanine aminotransferase (ALT) levels. A diagnosis of hepatitis A was indicated by samples positive for anti-HAV IgM; a diagnosis of hepatitis B was indicated by samples positive anti-HBc IgM; and a diagnosis of hepatitis C was indicated by samples positive anti-HCV. ULN: the upper limit of normal.