
Figures & data
Figure 1. Schematic representation of the timeline of H9N2 AIV infections among chickens, a pet cat, and two humans at a backyard farm in Guangxi Province, October 2018.
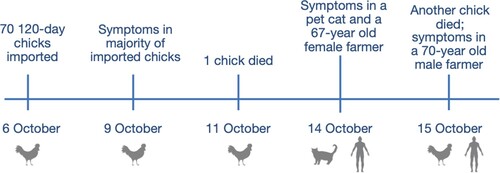
Figure 2. HI and MN titres against different influenza viruses of the plasma samples from H9N2 infected couple. Plasma samples of the two recovered humans were collected on the 25th day after the symptom onset. Dashed lines labelled the 1:40 and 1:80 as the low limits for the positive (A) HI and (B) MN titres, respectively. Human 1 and 2 represent the female and male patients, respectively. Virus isolates used in the assay including A/Guangxi/NN10.19T-NGS/2018(H9N2), A/Shenzhen/TH002/2015(H5N6), A/Brisbane/02/2018(pH1N1), A/Kansas/14/2017(H3N2), B/Colorado/06/2017(Bv), and B/Phuket/3073/2013(By).
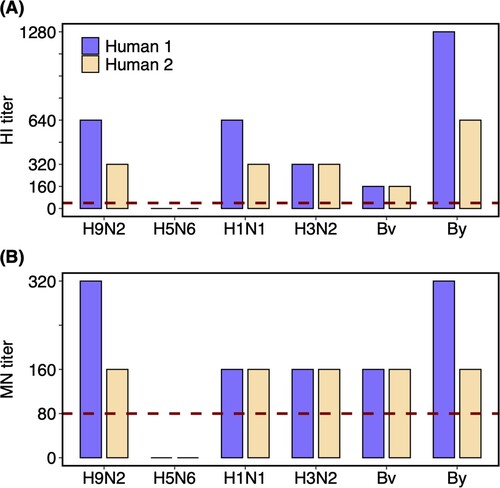
Figure 3. Receptor-binding properties of H9N2 AIVs isolated from the patient, cat, and chicken. Receptor-binding properties of H9N2 isolated from (A) the human, (B) cat, (C) chicken, and (D) A/Vietnam/1194/2004(H5N1) and (E) A/California/04/2009(H1N1) to human-type (α2-6-SA) and avian-type (α2-3-SA) receptors were detected by the solid-phase direct binding assay with the trisaccharide receptors. The human-type and avian-type receptors are colored by red and blue, respectively. The mean of values obtained by reading the absorbance three times was shown by points. (F) Receptor-binding properties of H9N2, H1N1 and H5N1 viruses were further confirmed by hemagglutination assays using red blood cells expressing different sialic acid receptors. GX represents Guangxi Province in sequence names. – represents negative.
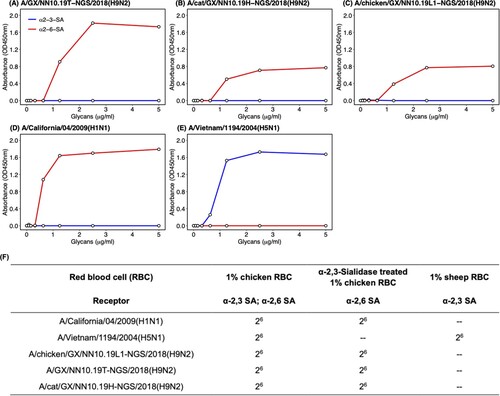
Figure 4. Pathogenicity of the H9N2 viruses from chicken, cat, and human in BALB/c mice. (A) Body weight changes of BALB/c mice inoculated with H9N2 viruses. (B) Lung viral titres (viral RNA copies) of infected mice were detected by qRT-PCR on 3, 5 and 7 days post-infection (dpi). The horizontal dashed line represents the lower limit of detection. (C) Lung index of the infected mice on 3, 5 and 7 dpi. Asterisk represents the statistically significant difference between the corresponding group and the control group given the Student’s T-test. *, p-value < 0.05; **, p-value < 0.01. (D)-(G) H&E staining results for the lung tissues of these H9N2 infected mice. The bar is 100 μm.
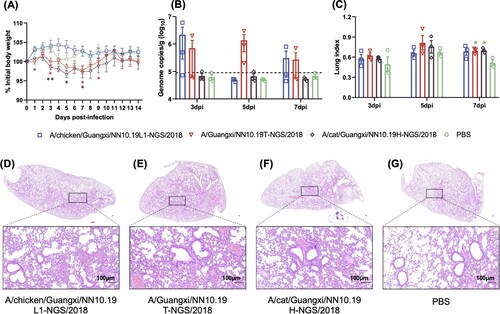
Figure 5. Modeling structure of the ectodomain of HA molecule of the human H9N2 isolate. The structure was modelled by a homology modelling method using A/swine/Hong Kong/9/98 as a template (PDB ID: 1JSD) in SWISS-model. K137N and T138A (H3 numbering) in the receptor binding domain (RBD) were labeled in red color. The RBD includes three secondary elements, 130-loop, 190-helix, and 220-loop, forming the edge of RBD, and four conserved residues, 98Y, 153W, 183H, and 195Y which form the base element.
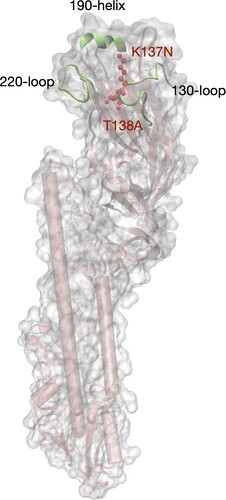
Table 1. Amino acid substitutions resulted from SNPs specific for H9N2 AIVs isolated from the human and cat in comparison with two others from chicken.
Table 2. Molecular characterization of four H9N2 AIVs in this study.
Figure 6. Phylogenetic trees of HA and NA genes of H9N2 AIVs in mainland China. H9N2 viruses isolated in this study are marked by orange asterisks and their sequence names are listed next to the asterisks in blue color. Human H9N2 from public databases are labeled by red stick figures of humans. Tips of each tree were colored by the isolation year of the corresponding tip taxa. Bars on the right represent multiple established lineages and clades given tree topology and genetic relationship. Numbers on the branches represent the support of corresponding clades.
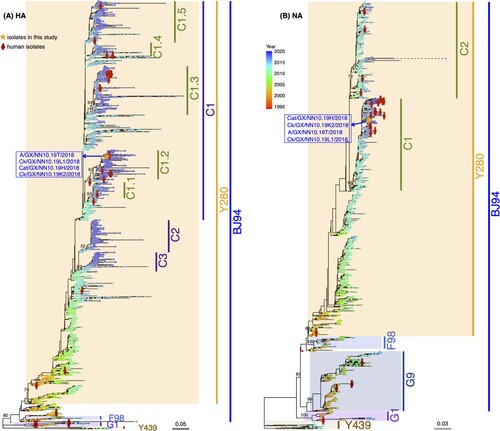
Table 3. Genetic source of eight gene segments of H9N2 AIVs in this study