Figures & data
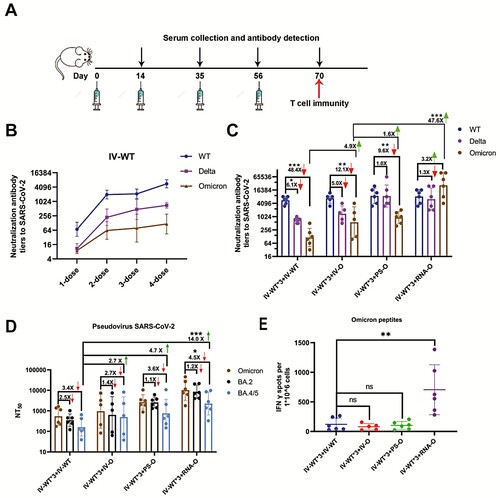
Figure 1. Booster doses of Omicron-adapted vaccines enhance the Nab response in mice. (A) Scheme of immunizations, serum collection, and T cell draws. (B) Nabs titers to WT virus at days 14, 35, 56, and 70. (C) Nabs titers to WT, Delta, and Omicron viruses at day 70. (D) Serum Nabs titers against pseudoviruses displaying Omicron spike proteins, BA.2, and BA.4/5 at day 70. (E) ELISPOT assay for IFN-γ in splenocytes. The red downward arrows represent a decreasing fold change and the green upward arrows represent an increasing fold change. (B–D) Bars represent geometric means, and error bars represent geometric standard deviations for each group. Statistical comparisons across groups were determined by one-way ANOVA with Bonferroni’s multiple comparisons test after log transformation. (E) Bars represent means ± SD. Statistical comparisons across groups were determined by one-way ANOVA with Tukey’s multiple comparisons test. (*p < 0.05; **p < 0.01; ***p < 0.001).