Figures & data
Figure 1. Study Enrolment and Outcomes (8 August 2021–24 October 2021).
Note: NAbs denotes neutralizing antibodies.
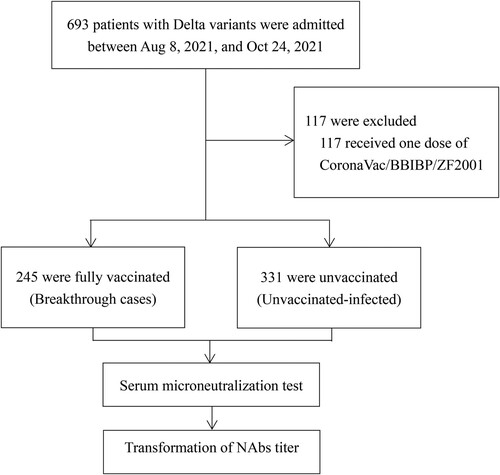
Table 1. Demographic characteristics and Vaccination history of the participants.
Figure 2. Trends in NAb levels over time from 1 to 7 weeks of the onset/infection. (A) NAbs of the ancestral and Delta strains in breakthrough cases. (B) Neutralizing curves of the ancestral and Delta strains in breakthrough cases from 1 to 7 weeks of the onset/infection by live virus microneutralization assay. (C) NAbs of the ancestral and Delta strains in unvaccinated-infected cases. (D) Neutralizing curves of the ancestral and Delta strains in unvaccinated-infected cases from 1 to 7 weeks of the onset/infection by live virus microneutralization assay. ****P < 0.0001. (E) Trends of Ct value among different NAbs value over days after symptom onset/infection. Case1-3: breakthrough cases with high-medium-low NAb level, case4-6: unvaccinated-infected cases with high-medium-low NAb level.
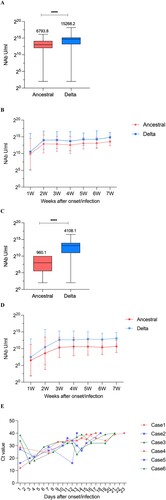
Table 2. The geometric mean concentrations (U/mL) of the NAb against ancestral and Delta strains in breakthrough cases and unvaccinated-infected cases from 1–7 weeks after the onset/infection.
Table 3. Viral clearance time and Ct value differences in different neutralizing antibody levels.
Figure 3. Kinetics of NAb according to clinical status. In breakthrough cases (A-C): (A) NAbs of the ancestral strain from 1-7 weeks of the onset/infection by live virus microneutralization assay. (B) NAbs of the Delta strain from 1-7 weeks of the onset/infection by live virus microneutralization assay. (C) NAbs of the ancestral and Delta strain. In un-vaccinated-infected cases (D-E): (D) NAbs of the ancestral strain from 1-7 weeks of the onset/infection by live virus microneutralization assay. (E) NAbs of the Delta strain from 1-7 weeks of the onset/infection by live virus microneutralization assay. (F) NAbs of the ancestral and Delta strain. Each circle represents the titer for a serum sample. ****P < 0.0001.
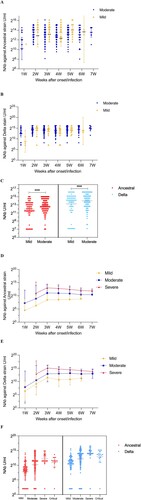
Figure 4. Impact of duration after SARS-CoV-2 vaccination on NAbs against ancestral and Delta variants in breakthrough cases. (A) Effect of SARS-CoV-2 vaccination duration on NAbs against the ancestral strain over weeks after onset/infection. (B) Effect of SARS-CoV-2 vaccination duration on NAbs against the Delta strain over weeks after onset/infection.
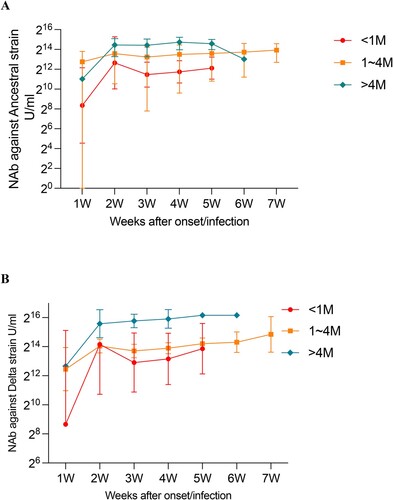
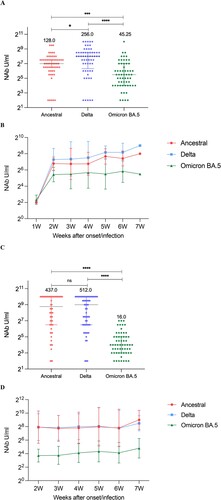
Figure 5. Neutralizing responses of three strains over time. (A) NAbs of the ancestral, Delta, and Omicron BA.5 in breakthrough cases. (B) Neutralizing curves of the ancestral, Delta, and Omicron BA.5 in breakthrough cases from 1 to 7 weeks of the onset/infection by live virus microneutralization assay. (C) NAbs of the ancestral, Delta, and Omicron BA.5 in unvaccinated-infected cases. Each circle represents the titre for a serum sample. (D) Neutralizing curves of the ancestral, Delta, and Omicron BA.5 in unvaccinated-infected cases from 1–7 weeks of the onset/infection by live virus microneutralization assay. ****P < 0.0001, ***P < 0.001, *P < 0.05, ns denotes no statistical differences.