
Figures & data
Figure 1. ASFV variants and lineages in Germany. Lineages are indicated by coloured header together with identified marker mutations in comparison to the German ASFV sequence LR899193 (set as reference lineage I). Variants are characterised by insertions/deletions in homopolymer and non-homopolymer regions as well as synonymous, missense and nonsense mutations found in annotated genes and intergenomic regions. Mutations used to discriminate variants are stated together with their gene positions relative to ASFV Georgia 2007/1 (FR682468.2). A complete list of all mutations identified in this study can be found in Table 1. In total, five lineages and ten variants could be discriminated based on this system. Figure created with Biorender.com.
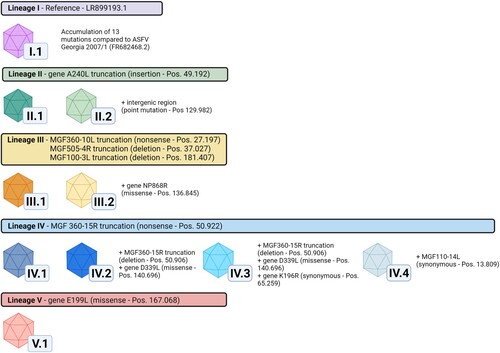
Table 1. Genetic differences in German ASFV variants compared to ASFV Georgia2007/1 (FR682468.2).
Figure 2. Model output as spatial snapshots with different variants differently coloured, either showing the dynamic development of infection distribution (a–c) or mapping the stochastic variability of the final distribution (d–f). Pixels represent social groups of individual wild boar and lines are administrative borders.
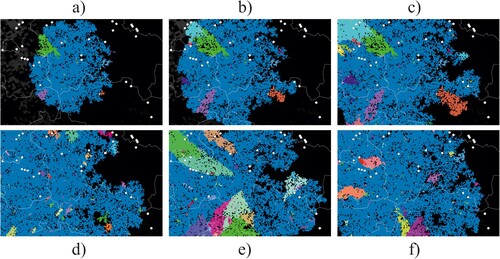
Figure 3. Model outcome of the number of emerging variants which affected at least 100 km2 of wild boar habitat. Box whisker plots summarise 100 model runs per value of the mutation parameter.
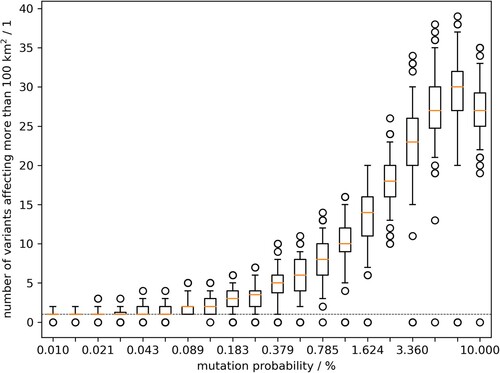
Figure 4. Geographic distribution of viral variants detected in the federal states of Saxony and Brandenburg along the Polish border (left). Confirmed ASFV cases in wild boars from 10 September 2020 until 12 August 2021 are depicted as circles (white), whereas outbreaks in domestic pigs are shown as pentagons (n = 3, areas A and B). In order to facilitate the visualization of spatial ASFV clusters, variants confirmed by Sanger sequencing (n = 834) were coloured according to their assignment to one of the five lineages.
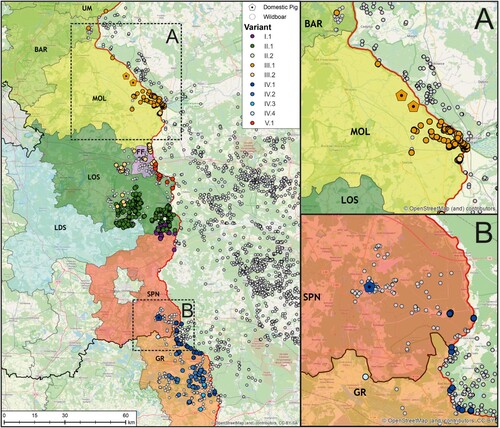
Figure 5. High-impact mutations in ASFV whole-genome sequences in comparison with the ASFV Georgia 2007/1 sequence (FR682468.2). Number of HI mutations in the ASFV WGS from Germany vs HI mutations in 5 WGS from the Ukraine and 20 publicly available WGS
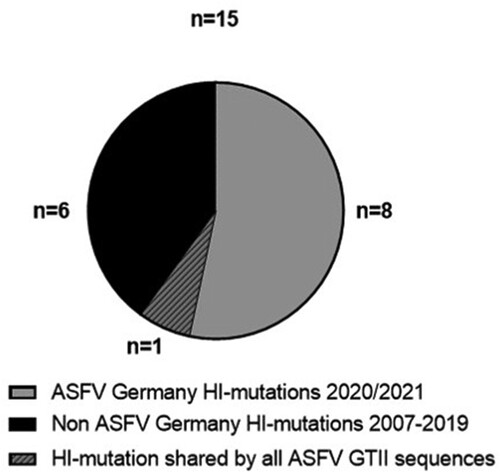
Figure 6. (A) Likelihood of observing 1 variant out of 3 sequenced samples (blue) and 10 out of 50 sequenced samples (orange) shown by the median value (bold line) and the 90% credibility interval (shaded area). The probabilities are estimated for varying rate of variants’ emergence (x-axis, log scaled). The green graph represents the joint distribution i.e. the probability to observe both sample outcomes with constant variants’ emergence rate. (B) Distributional details of the green graph i.e the joint probability.
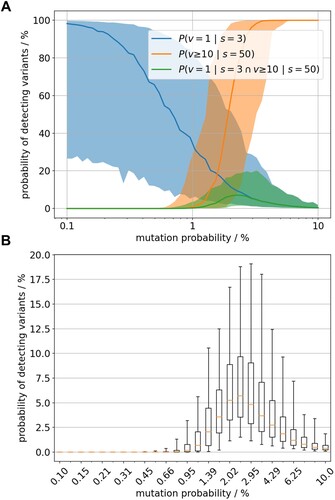
Figure 7. Comparison of O174L wildtype and mutant nucleotide and protein sequence and the effects of observed mutations on the wild-type ASFV PolX protein structure. Alignment of ASFV O174L wildtype and mutant nucleotide sequence (A) and protein sequence (B) including structural information from the literature [Citation34]. Catalytic sites (red box), mutation site (blue box), amino acids forming the 5’-binding pocket (green box) and altered amino acids (magenta letters) are highlighted. The nucleotide alignment was done using MAFFT v7.4506 and the protein alignment using Clustal W in Geneious. (C) X-ray structure of wild-type ASFV PolX in complex with nicked DNA (PDB accession: 5HRI) [Citation34]. Positions with altered sequence in the mutant are coloured in cyan and positions that are missing in the mutant are coloured in magenta. The illustration was prepared with PyMol (Schrödinger, Inc.).
![Figure 7. Comparison of O174L wildtype and mutant nucleotide and protein sequence and the effects of observed mutations on the wild-type ASFV PolX protein structure. Alignment of ASFV O174L wildtype and mutant nucleotide sequence (A) and protein sequence (B) including structural information from the literature [Citation34]. Catalytic sites (red box), mutation site (blue box), amino acids forming the 5’-binding pocket (green box) and altered amino acids (magenta letters) are highlighted. The nucleotide alignment was done using MAFFT v7.4506 and the protein alignment using Clustal W in Geneious. (C) X-ray structure of wild-type ASFV PolX in complex with nicked DNA (PDB accession: 5HRI) [Citation34]. Positions with altered sequence in the mutant are coloured in cyan and positions that are missing in the mutant are coloured in magenta. The illustration was prepared with PyMol (Schrödinger, Inc.).](/cms/asset/066d6c32-47a7-4cce-b651-dd508c11c7c7/temi_a_2146537_f0007_oc.jpg)