Figures & data
Figure 1. Omicron BA.1 breakthrough infection recalled broadly reactive antibody responses and activated diverse memory B cell clonotypes. (A) The neutralization activity of plasma derived from the patient Omicron-01 was determined against pseudotyped SARS-CoV-2 WT and variants including Omicron sub-lineages. (B) Antibody gene repertoire analysis of reactive memory B cells derived from Omicron-01. In each pie chart, the number of cloned antibody genes is shown in the centre for the heavy (H) or light (L) chains. The colours represent variable gene families and each fragment of the same colour stands for one specific sub-family. The histograms summarize the number of antibodies encoded by each IGHV or IGKV gene sub-family. The coloured stars indicate the IG genes of eight identified antibodies: P1D9 (blue), P1F8 (orange), P2B4 (red), P2B11 (green), P2D9 (yellow), P2E7 (cyan), P3E2 (magenta) and P3E6 (purple). (C) The percentage of somatic hypermutation (SHM) compared to germline sequences and the CDR3 amino acid lengths of recovered H and L chain sequences are presented in scatter dot plots. (D) The gene enrichment of 63 mAbs displaying SARS-CoV-2 WT spike-binding activity is compared to that of 35 mAbs with neutralization activity. The proportions of IGHV and IGKV genes encoding those antibodies are shown in the bar. (E) The chord chats display the variable pairings between recovered H chain and L chain V genes. The outer circle border indicates the number of each pairing. The inner-coloured lines represent P1D9 (blue), P1F8 (orange), P2B4 (red), P2B11 (green), P2D9 (yellow), P2E7 (cyan), P3E2 (magenta) and P3E6 (purple), respectively. (F) The chord charts display the variable combination of V, D and J genes of 122 recovered H chains. The outer circle border indicates the number of each combination. (G) The chord chart displays the variable combination of V and J genes of 129 recovered L chains. The outer circle border indicates the number of each combination.
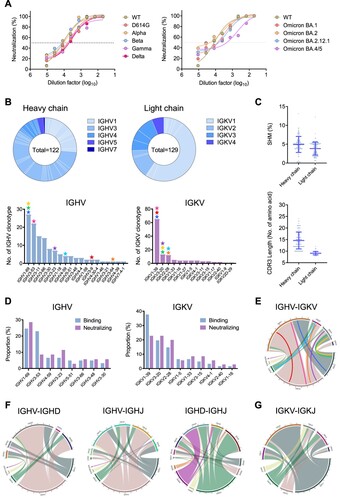
Figure 2. Multiple bNAbs display distinct neutralization profiles against pseudotyped SARS-CoV-2 variants. (A) The neutralization activity of P1D9, P1F8, P2B4, P2B11, P2D9, P2E7, P3E2 and P3E6 against pseudotyped SARS-CoV-2 WT and variants. The dashed line in each graph indicates 50% neutralization. (B) The summary of IC50 of the above NAbs. Published NAb controls from class I-IV (S2E12, ZCB11, B8, LY-CoV1404 and S2X259) are highlighted in colour. Ranges are indicated according to the colour bar below.
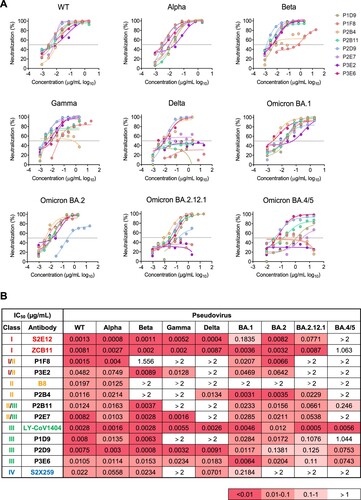
Figure 3. Surface plasmon resonance analysis reveals binding epitopes of newly identified bNAbs. (A) Competitive binding between NAbs to SARS-CoV-2 WT RBD. The curves show the binding of P2B4 from class II to RBD without (green) or with (red) pro-incubation of competitor NAbs including B8 as control. The heatmap summarizes the ratio of response units (RU) difference between indicated antibodies including controls, expressed as a percentage. The time point of RU for analysis is when the binding steady state was reached. No competitive binding (<30%), partially competitive binding (30-80%) and totally competitive binding (>80%) are indicated with gradient colour. (B) Binding kinetics of P2B4, P1D9, P2D9 and P3E6 to SARS-CoV-2 WT RBD was determined by SPR. (C) The summary IC50 of P2B4, P1D9, P2D9 and P3E6 against pseudotyped SARS-CoV-2 WT with F486V, D614G or D614G plus the indicated point substitutions found within the RBD. Fold change of IC50 values relative to WT or D614G are indicated according to the colour bar below.
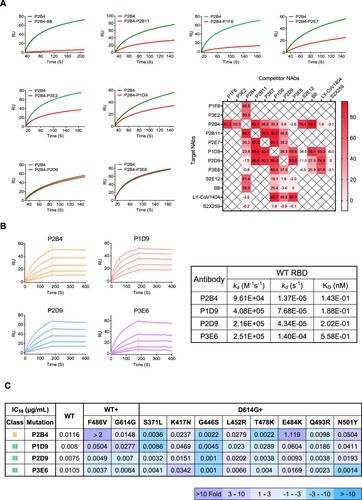
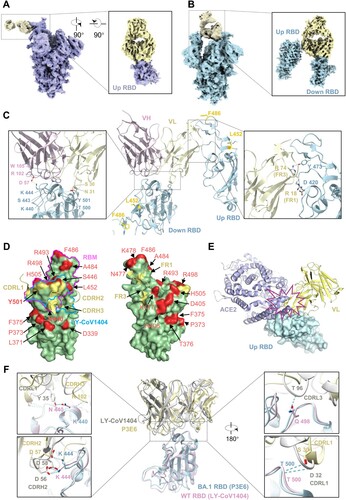
Figure 4. Structural basis of class II NAb P2B4 for viral neutralization and escape. (A) Cryo-EM density map of SARS-CoV-2 WT spike in complex with P2B4 Fab. NTD is shown in orange, RBD in green, glycans in red, with Fab heavy chain in dark cyan and light chain in light cyan. The cartoon represents the structure of P2B4 variable regions binding WT RBD after local focused refinement. The variable region of light chain (VL), of heavy chain (VH) and RBD are coloured light cyan, dark cyan and olive, respectively. (B) P2B4 CDR L2/L3/H3 are involved in binding WT RBD (left). The receptor-binding motif (RBM) is coloured light purple. The epitope is shown in cyan on RBD surface with VOCs mutation sites coloured red (right). E484, Q493 and Y505 in bold font are included in the epitope of P2B4. (C) Structural basis of P2B4 neutralization. Residues of CDRs and RBD involved in interaction are labelled in light cyan (CDR L2/L3), dark cyan (CDR H3) and olive (RBD), respectively. Hydrogen bonds and salt bridges are represented by yellow dashed lines. (D) Structural basis of P2B4 evasion. Mutations in E484, Q493 and Y505 are labelled in P2B4 Fab-WT RBD complex (P2B4 in cyan and RBD in green) aligned with Beta RBD (PDB:7VX4, light purple) or Omicron BA.1 RBD (PDB:7TLY, grey). F486 in BA.1 RBD is substituted into valine to structurally simulate BA.4/5. Hydrogen bonds are represented by yellow dashed lines.
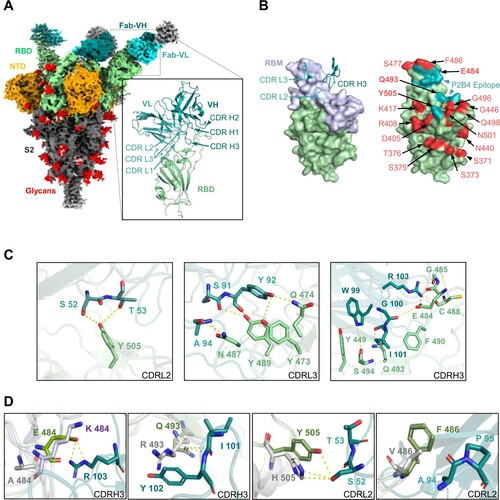
Figure 5. Structural basis of class III P1D9 and P2D9 for viral neutralization and escape. (A) The cartoon represents the structure of P1D9 variable regions binding SARS-CoV-2 WT RBD after local focused refinement. The variable region of light chain (VL), of heavy chain (VH) and RBD are coloured light yellow, orange and olive, respectively. (B) The cartoon represents the structure of P2D9 variable regions binding SARS-CoV-2 WT RBD after local focused refinement. VL, VH and RBD are coloured violet, blue and olive, respectively. (C) P1D9 CDR L1/L3/ H2/H3 and P2D9 CDR L3/H2/H3 are involved in binding WT RBD (left). RBM is coloured light blue. P1D9, P2D9 and their overlapped epitope are shown in orange, blue and magenta on the RBD surface, respectively (right). VOCs mutation sites are coloured red, and G446, G339 as well as N440 included in the epitope are in bold font. The epitope of published NAb LY-CoV1404 is labelled in brown. (D) Structural basis of P1D9 neutralization. Residues of CDR and RBD involved in interaction are labelled in light yellow (CDR L1/L3), orange (CDR H2/H3) and olive, respectively. Hydrogen bonds and salt bridges are represented by yellow dashed lines. (E) Structural basis of P2D9 neutralization. Residues of CDR and RBD involved in interaction are labelled in violet (CDR L3), blue (CDR H2/H3) and olive, respectively. Hydrogen bonds and salt bridges are represented by dashed lines. (F) Structural basis of P1D9 and P2D9 evasion. Mutations in G446 and L452 are labelled in P1D9 Fab-WT RBD complex (P1D9 in orange and RBD in green) aligned with Omicron BA.1 RBD (PDB:7TLY, purple) or Delta RBD (PDB:7W9F, grey) (Top). L452 in WT RBD is also substituted into Glutamine (pink) to structurally simulate BA.2.12.1. Mutations in G339 and N440 are labelled in P2D9 Fab-WT RBD complex (P2D9 VH in blue, VL in violet and WT RBD in green) aligned with BA.1 RBD (PDB:7TLY, purple) (bottom). Hydrogen bonds are represented by yellow dashed lines. (G) Structural overlay of P1D9/P2D9 Fab-WT RBD (purple) complexes with BA.2 RBD (PDB:7UB6, grey). The 366–377 hairpin and N343 glycan in RBD interacting with P1D9 CDR L1 coloured light yellow and P2D9 CDR H3 coloured blue are zoomed in.
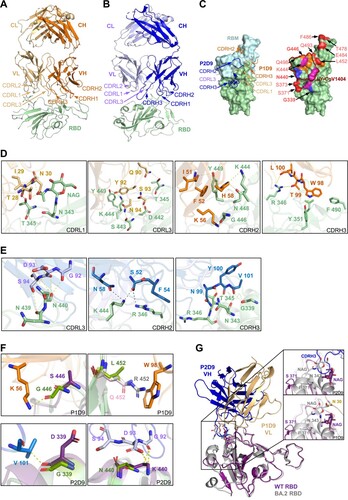
Figure 6. Unique interaction between class III P3E6 Fab and Omicron BA.1 spike. (A and B) Cryo-EM density map of SARS-CoV-2 Omicron BA.1 spike in complex with P3E6 Fab. Two different binding modes of P3E6 are shown. Spike trimer with one up and two down RBDs (1u2d) is coloured purple (A), as well as with two up and one down RBDs (2u1d) is coloured blue (B), respectively. P3E6 Fab is coloured yellow. (C) Interaction between P3E6 Fab and BA.1 RBD. P3E6 Fab is shown as the variable region of heavy chain (VH, pink) and light chain (VL, light yellow), and RBDs in up or down conformation are coloured blue. Two interfaces are zoomed in to show key residues contributing to the interaction. (D) P3E6 CDR L1/H2/H3 are involved in binding BA.1 RBD (left). The epitope is shown in light yellow on the RBD surface. VOCs mutation sites are coloured red, and K440 as well as Y501 included in the epitope are in bold font. RBM and the epitope of published NAb LY-CoV1404 are labelled in magenta and blue, respectively. FR1/FR2 of P3E6 light chain interact with a separate up RBD (related to c right) and contribute to stabilizing the structure (right). (E) Binding of P3E6 light chain to an up RBD (related to C right) prevents binding of the ACE2 receptor. ACE2 and the VL are coloured purple and light yellow, respectively. (F) Comparison between the binding pattern of P3E6 (light yellow) in complex with BA.1 RBD (light blue) and LY-CoV1404 (PDB: 7MMO, grey) in complex with WT RBD (pink). The residues involved in the interaction are labelled.