
Figures & data
Figure 1. Fetal data. (A) Experimental setup in the fetal study. (B) Fetal mortality (Yates-corrected χ2-test); % shows live fetuses. In the Control group, there were 8 viable fetuses and no dead fetuses. The ZIKV group had 13 viable fetuses and 2 dead decomposed fetuses. (C) Zika virus infection in fetuses (Mann-Whitney U-test). Samples from all live and dead fetuses were tested. (D) Cytokine responses in fetal blood plasma (Mann-Whitney U-test). Samples from live fetuses were tested. The dotted lines represent the limit of detection (LOD) or limit of quantification (LOQ). The solid line represents the mean. In all graphs, squares and circles indicate individual fetuses. Filled red circles represent fetuses directly inoculated with ZIKV.
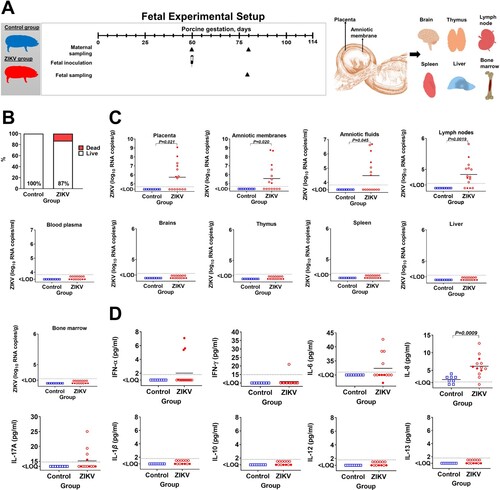
Figure 2. Sialoadhesin expression in fetal organs. (A) Sialoadhesin-specific immunohistochemistry in fetal organs. The red staining represents sialoadhesin-positive cells. In fetal organs (except the brain) the staining pattern was diffused. In the brain, positive cells were localized in the meninges. (B) Digital quantification of the sialoadhesin-positive area in tissues. The solid line represents the mean. The percentage of sialoadhesin stained area in the fetal organs was compared with Mann-Whitney U-test. (C) Spearman correlation between sialoadhesin and ZIKV loads in the placenta. The X-axis represents ZIKV log10 RNA copies per g. In all graphs, squares and circles indicate individual fetuses. Filled red circles represent fetuses directly inoculated with ZIKV.
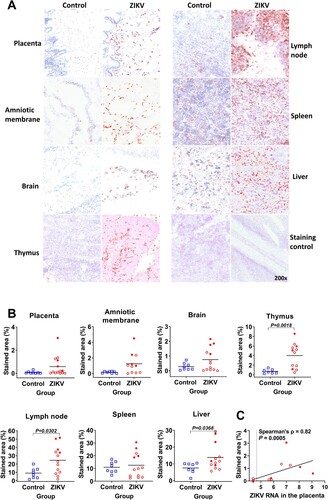
Figure 3. Molecular pathology in the bone marrow of Zika-affected fetuses and offspring. (A) Western blot semi-quantification of sialoadhesin (Sn) expression in the whole bone marrow cells of fetuses (Mann-Whitney U-test). Corresponding western blot images are in Suppl. Figure S2. Squares and circles indicate individual fetuses. Filled red circles represent fetuses directly inoculated with ZIKV. (B and C) Differentially phosphorylated proteins (p < 0.05) in whole bone marrow cells of Zika-affected fetuses identified with kinome analysis. Raw data are in Table S1-A. Some proteins have more than one differently phosphorylated site; all differently phosphorylated sites for each protein are shown. (D) Western blot semi-quantification of sialoadhesin expression in the whole bone marrow cells of offspring (Mann-Whitney U-test). Squares and circles indicate individual piglets. (E and F) Differentially phosphorylated proteins (p < 0.05) in whole bone marrow cells of Zika-affected offspring identified by kinome analysis. Raw data are in Table S1-C. Some proteins have more than one differently phosphorylated site; all differently phosphorylated sites for each protein are shown.
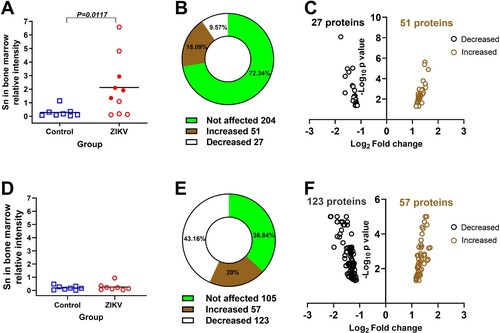
Figure 4. Differentially phosphorylated proteins related to immune activation, hematopoiesis, and cancer in the bone marrow of Zika-affected fetuses and offspring. Some proteins have more than one differently phosphorylated site; all differently phosphorylated sites for each protein are shown. All proteins affected in fetuses (except MSK2, SOC3, AR, JNK1, SMAD6, BAX, TGFBR2, IRAK4) were also affected in offspring (upper panel). In addition to proteins commonly affected in fetuses and offspring, offspring also had individually affected proteins (lower panel). Raw data are in Tables S1-A, C.
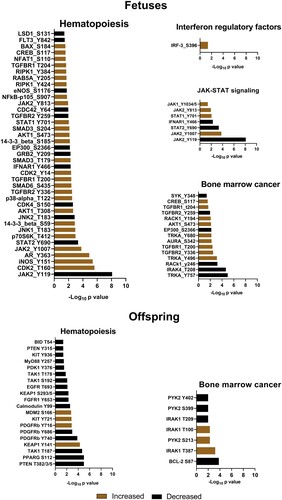
Figure 5. Offspring data. (A) Experimental setup in the offspring study. (B) Mortality (Yates-corrected χ2-test; % shows live piglets), head/body size ratio (Mann-Whitney U-test), and Zika loads in individual amniotic membranes from newborn piglets (Mann-Whitney U-test). There were 11 viable piglets in the Control group with no dead piglets. In the ZIKV group, there were 11 viable and 3 dead piglets. The dotted line represents the limit of detection (LOD). The solid line represents the mean. (C) The colony-forming unit assay. The image represents a granulocyte/macrophage colony-forming unit. The first graph shows the number of CFU-GM (granulocyte/macrophage colony-forming units) in Control and Zika offspring. For each animal, the total number of colonies was counted in 6 technical well replicates and the average is shown. The second graph shows the absolute number of GMP in Control and Zika offspring. GMP: granulocyte/macrophage progenitor cells. CFU-GM were disrupted to single-cell suspension, and the total number of GMP cells was calculated from 6 technical well replicates. Solid lines represent the mean. Mann–Whitney U-test was used to compare the number of CFU-GM and GMP. In all graphs, squares and circles indicate individual piglets.
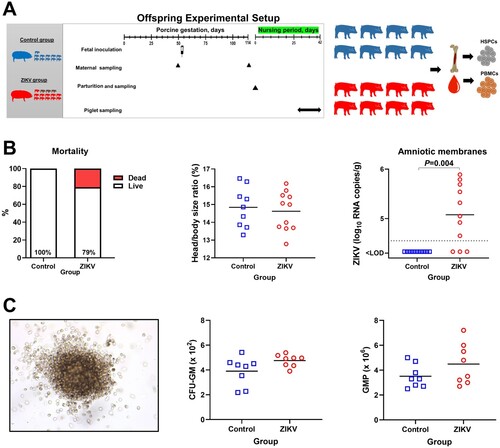
Figure 6. Cytokines in the blood plasma of offspring affected by silent Zika virus infection during in utero life. Blood plasma samples from Control and Zika offspring were collected 26 days after birth. Dotted lines represent the limit of quantification (LOQ); solid lines represent mean values. Cytokine levels in offspring blood plasma were compared with Mann-Whitney U-test. Squares and circles indicate individual piglets.
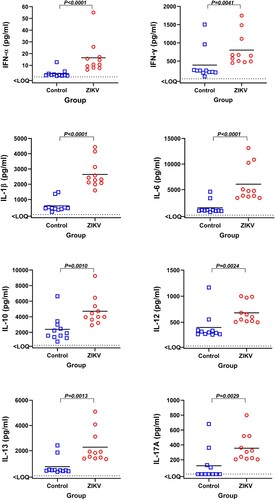
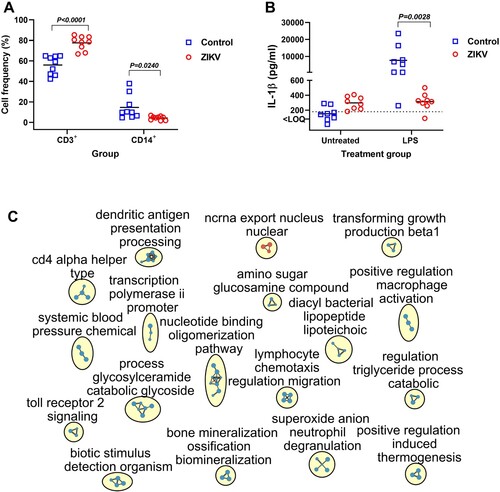
Figure 7. Functional and molecular pathology in PBMCs of offspring affected by silent Zika virus infection during in utero life. (A) Quantification of CD3 + and CD14 + cells in offspring PBMCs (Mann–Whitney U-test). Squares and circles indicate individual piglets. (B) Lipopolysaccharide (LPS)-induced IL-1β response in offspring PBMCs (Mann–Whitney U-test). Solid lines represent the mean. The dotted line represents the limit of quantification (LOQ). (C) Molecular pathology network in PBMCs of offspring affected with silent in utero Zika virus infection. The enrichment map of significantly altered GO biological processes. Red are pathways with positive and blue are with negative enrichment. All subnetworks with FDR-adjusted p < 0.25 and at least three connected nodes are shown. See raw data in Table S2-D for individual GO biological processes.
Supplemental Material
Download Zip (5.1 MB)Data availability
An accession number for raw RNA-seq data is PRJNA814280 in NCBI BioProject.