Figures & data
Figure 1. Purification and characterization of CV-A10 particles. CV-A10 particles were harvested from infected Vero cells, purified by CsCl gradient ultracentrifugation, and inactivated by formaldehyde as described in the materials and methods. (A) The positions of empty and full particles (EP, FP) were indicated in CsCl gradient (equilibrium at a starting density of 1.30 g per ml). The density of EP and FP particles was measured by an Ernst Abbe refractometer. (B) The purified particles EP, FP and their mixture MP (EP: FP = 4:6) were subjected to SDS-PAGE and Western blotting assays with rabbit polyclonal antibodies against whole virus, VP2 and mouse monoclonal antibody against VP1, VP3 (Rb-α-virion, mAb-α-VP1, Rb-α-VP2 and mAb-α-VP3). VP0, VP1, VP2, VP3 and VP4 were labelled on the right, and the molecular weight markers in KDa were indicated on the left. Mouse antibody against β-actin was used as loading control. (C) Electron microscope of inactivated EP and FP particles. Scale bar, 100 nm.
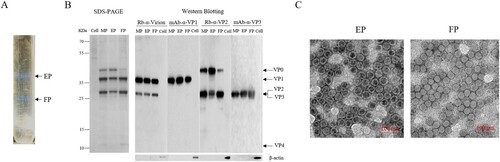
Figure 2. Humoral immune response and persistence of the inactivated CV-A10 vaccine. (A) The animal experiment was performed following the procedures explained in the schematic diagram. Groups of 6∼8 weeks old BALB/c mice were injected intraperitoneally with the inactivated CV-A10 vaccine on weeks 0 and 2 at doses of 0.5 or 2.0 μg per mouse (n = 8 per group). Control group was inoculated with Alum. Bleeding was performed on weeks 2, 4, 6, 8, 10 and 18, and the in vitro neutralizing antibody (NtAb) assay of the sera were performed. (B) NtAb levels were presented as the geometric mean titre (GMT) ± the standard error of the mean (SEM). Each symbol represented a mouse and the solid line indicated the GMT of the group. The bold numbers above the symbols represented the GMT of each group. NtAb titres below 8 were assigned to 2 for the convenience of presentation. One-way ANOVA was used for analysis of statistical significance: n.s., not significant (P ≥ 0.05); *, 0.01 ≤ P < 0.05; **, P < 0.01; ***, P < 0.001 and ****, P < 0.0001.
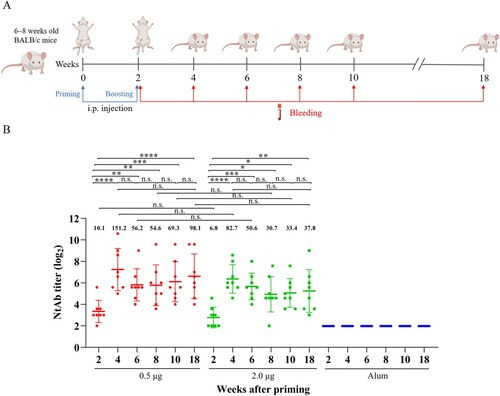
Figure 3. Specificity of proliferative T cell responses following CV-A10 immunization. Spleen cells of three BALB/c mice from groups were isolated for ELISPOT assays 14 days after secondary immunization with the inactivated CV-A10 vaccine. Proliferation was measured and the spot-forming cells (SFC) of spleen cells were counted 36 h after stimulation with synthetic peptides spanning the whole capsid protein. (A) Five adjacent peptides were mixed together to constitute a peptide pool, except for the single peptide VP4-(aa 52–69). (B) the peptide pools which could elicit strong positive T cell response were separated into single peptide. The selection criteria for positive responses were that the mean of detected SFC was ≥ 50 SFC per 2 × 10⁵ input cells.
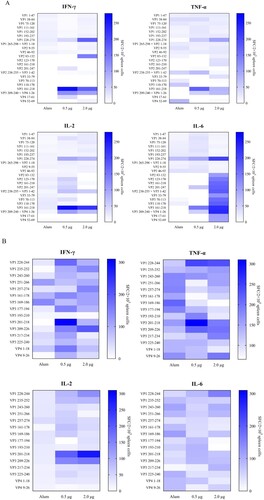
Figure 4. Alignment analysis of dominant epitopes among human enteroviruses. (A) Three identified T cell epitopes were highly conserved within circulating CV-A10 isolates. (B) The sequence of three epitopes showed obvious variation among other major circulating enteroviruses. The red amino acid sequences indicated the overlapping region between VP3-(aa 201–218) and VP3-(aa 209–226).
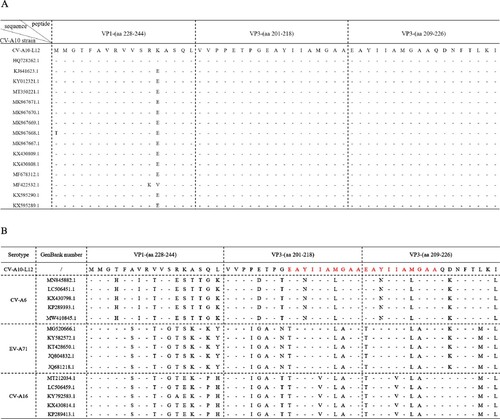
Figure 5. CV-A10-M14 susceptible Kunming mouse model. Kunming mice at 12 and 14 days of age were intraperitoneally (i.p.) inoculated with CV-A10-M14 at dose of 9.5 × 10⁸ CCID50/mouse. Control groups were inoculated with MEM medium. Survival rate (A) and clinical scores (B) were monitored and recorded daily until 14 days post-infection (dpi). The LD50 of CV-A10-M14 was determined through the i.p. inoculation at the doses ranging from 9.5 × 10⁵ to 9.5 × 10⁸ CCID50/mouse (C).
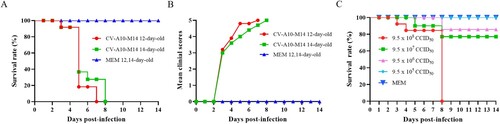
Figure 6. Protective efficacy of inactivated CV-A10 vaccine in the CV-A10 active immunized-challenged mouse model. (A) The animal experiment was performed as the schematic diagram showed. Kunming mice (n = 10) were primed and boosted via i.p. route at low or high dose (0.5 or 2.0 μg/mouse) on days 3 and 9, and challenged at a dose of 25 LD50 (4.8 × 10⁹ CCID50/mouse) on day 14. Control groups were immunized with Alum. The dates of vaccination and challenge were indicated by black and orange arrows, respectively. Bleeding (red arrows) was performed on days 0, 14, 18 and 28. The Alum-inoculated mice were euthanized before dying on day 18 to collect the sera. Tissues collection (blue lines) was performed on days 18 and 28. The body weight changes (B), clinical scores (C) and survival rate (D) were monitored daily until 14 days post-infection. (E) NtAb titres of the sera collected at different time points (n = 5 for each group) were determined and presented as the GMT (the solid line) ± SEM. For the convenience of figure presentation, NtAb titres below 8 were assigned to 2. Each symbol represented a mouse. **, **** and n.s., indicating P < 0.01, P < 0.0001 and no significant difference, respectively.
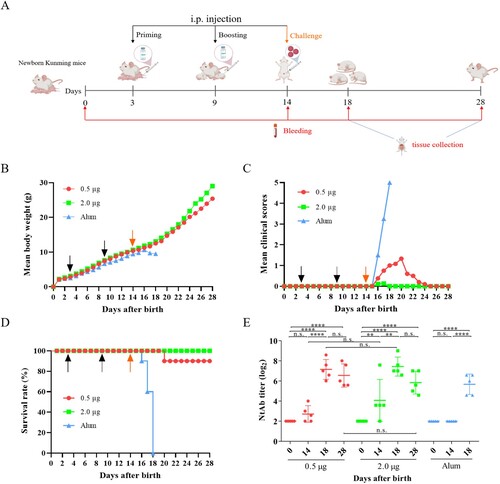
Figure 7. Tissue virus loads in immunized and challenged Kunming mice. Kunming mice inoculated with 0.5, 2.0 μg vaccines or Alum were infected with 25 LD50 (4.8 × 10⁹ CCID50/mouse) of CV-A10-M14. To detect the viral load via qRT-PCR, heart, liver, spleen, lung, kidney, brain, intestine, blood and hindlimb muscle tissues were collected from the mice at 4 and 14 day-post-challenge. Virus loads were quantified by a standard curve obtained from 10-fold serial dilutions of CV-A10 transcript. The data represent the mean ± SEM for five mice per group and were analysed with one-way ANOVA (*, 0.01 ≤ P < 0.05; **, P < 0.01; ***, P < 0.001; ****, P < 0.0001).
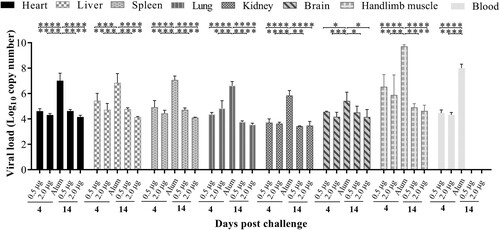
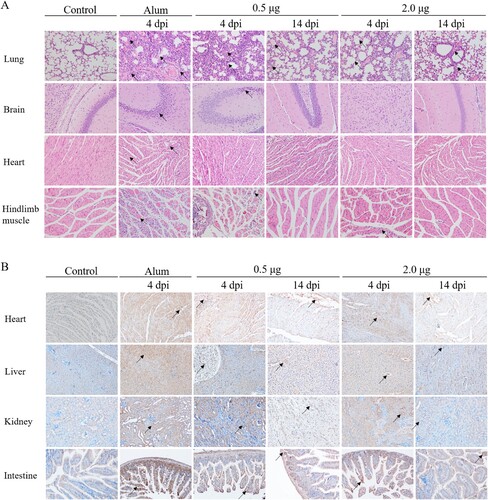
Figure 8. The analysis of the histopathological (H&E) and immunohistochemical (IHC) examination of tissues from immunized-challenged mice (200×). Immunized Kunming mice were inoculated i.p. with CV-A10-M14. The Alum groups were euthanized at 4 days post-challenge, and mice in the vaccinated groups were euthanized at 4 and 14 day-post-challenge. The healthy Kunming mice at the age of 28 days served as the negative control. For the convenience of figure presentation, “days post-challenge” was represented by “dpi.” (A) The lung, brain, heart and hindlimb muscle organs were sectioned and observed. (B) IHC assays for the organs of heart, liver, kidney and intestine were performed using a rabbit polyclonal antibody against CV-A10 whole virus. Black arrows indicated representative pathological damage (A) and expression of viral protein (B).