Figures & data
Figure 1. Illustrating generation of different gene-deleted African swine fever viruses: (A) Schematic for the construction of different gene-deleted ASFVs. The deleted gene segments were replaced by the Pp72-EGFP, Pp72-mCherry, or Pp72-BFP expression cassette as shown. (Note: The white arrowhead to the left of the BFP represent remaining 3'-I117L gene sequence). (B) The virus-infected primary BMDM cells expressing differential fluorescence. (C) In vitro growth characteristics of different gene-deleted ASFVs where primary BMDM cells are infected (0.01 m.o.i) with the viruses, and virus yields were titrated at the indicated times post-infection. Data are represented as means and standard deviations. The viral titers were exhibited by log10 TCID50/ml. (**P < 0.01, ***P < 0.001).
Figure 2. In vivo evaluation of different gene-deleted African swine fever viruses (ASFVs). (A) Timeline for animal experiments. The groups of commercial pigs were inoculated twice with 105.00 TCID50 of different gene-deleted ASFVs and then challenged at 28 dpi with lethal ASFV-GZ virus inoculated intramuscularly (i.m.). Pigs were observed for 21 days post-challenge and then euthanized. (B) The rectal temperature of the pigs inoculated with different gene-deleted ASFVs and challenged with lethal ASFV-GZ virus. *P < 0.05, the mean rectal temperature of pigs in the ASFV-GZΔI177L group was significantly higher than that in the ASFV-GZΔI177LΔCD2vΔMGF group at 10–23 days post-inoculation and 13–16 days post-challenge. (C) The clinical score of the pigs were recorded and calculated after inoculation and challenge. **P < 0.01, the mean clinical score in the ASFV-GZΔI177L group was significantly higher than that in the ASFV-GZΔI177LΔCD2vΔMGF group. (D) Survival curve of the pigs after inoculation and challenge.
Figure 3. Evaluation of virulence protective efficacy in pigs. (A–D) The viremia in pigs after inoculation and challenge. (E–H) The virus shedding in oral-swabs from pigs after inoculation and challenge. (I–L) The virus shedding in nasal swabs from pigs after inoculation and challenge. (M–P) The virus shedding in anal swabs from pigs after inoculation and challenge.
Table 1. Swine survival and fever response of the pigs following challenge with the lethal ASFV-GZ virus.
Figure 4. The histopathological sections (H&E) of the tonsil, submental lymph node, thymus, and spleen. The organs and tissues were collected from the pigs inoculated with 105.00 TCID50 of ASFV-GZΔI177L (Column A), ASFV-GZΔI177LΔCD2v (Column B), and ASFV-GZΔI177LΔCD2vΔMGF (Column C) and then challenged with 104.00 TCID50 of ASFV-GZ. Column D, the tissues were collected from the mock pigs challenged with 104.00 TCID50 of ASFV-GZ. Notes: Submental LN–Submental lymph node.
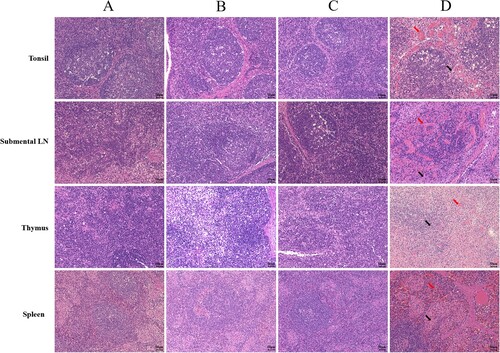
Figure 5. Evaluation of host immune response. (A) Assessment of cytokines in pigs inoculated with ASFV-GZ, ASFV-GZΔI177L, ASFV-GZΔI177LΔCD2v, or ASFV-GZΔI177LΔCD2vΔMGF. The heatmap was drawn using the mean of each group. (B) The antibody response curves from different groups of pigs after inoculation and challenge. The anti-ASFV antibodies have been detected using an ASF competitive ELISA antibody detection kit. The competitive percentage (S/N %) was calculated. Samples presenting a S/N %: ≤ 40% were considered positive; 40–50% was considered doubtful; ≥ 50% was considered negative. (C) Replication of ASFV-GZΔI177LΔCD2vΔMGF in pigs. 8 two-month-old commercial domestic pigs were inoculated with a dose of 107.00 TCID50 of ASFV-GZΔI177LΔCD2vΔMGF virus and one pig at indicated time points was euthanized to collect blood, oral swabs, nasal swabs, anal swabs and organs for viral DNA detection.
Figure 6. Safety evaluation in pigs. The ASFV-GZΔI177LΔCD2vΔMGF virus was serially passaged in pigs, indicating samples collected from the pigs that were euthanized on 3 dpi for viral DNA detection. The viral DNA copies of ASFV-GZΔI177LΔCD2vΔMGF virus from the 1st to 5th passage are shown in panels A to E, respectively. Note: LN–lymph node.
Figure 7. In vitro gene stability assessment. (A) The ASFV-GZΔI177LΔCD2vΔMGF virus was mixed with the same dose of ASFV-GZ in equal volume (106.0 TCID50 /ml), and then serially passed in primary BMDM cells at a 2% (V/V) dose. After 72 hpi, the presence of fluorescence from 1st to 5th passage was detected under a fluorescence microscope (ECHO Global) (10×). (B) The percentage of ASFV-GZΔI177LΔCD2vΔMGF-infected cells was determined by counting at least 200 cells from three independent experiments.